
Figure EV3. Mitochondrial characteristics of Mito‐C treated cells.
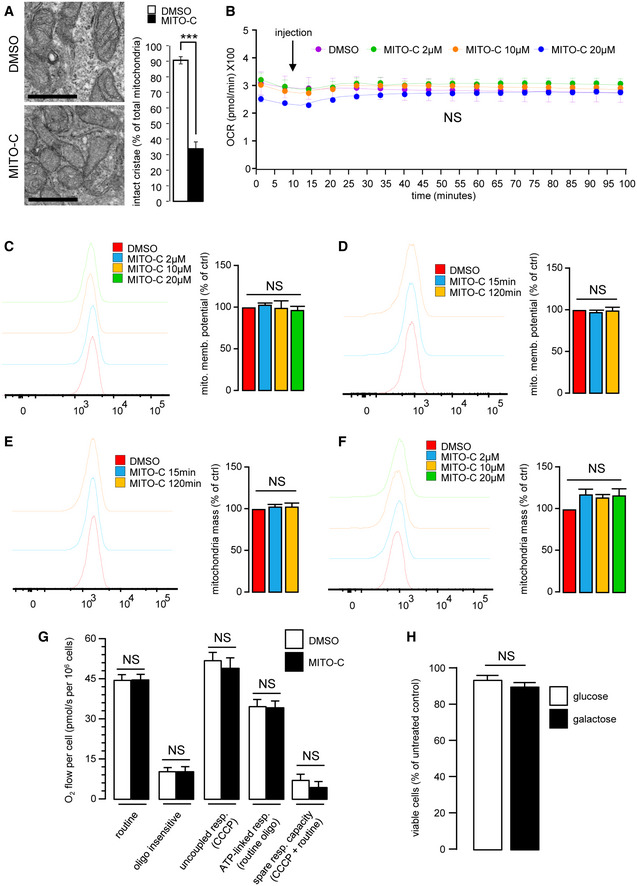
- HeLa cells were treated with 2 µM Mito‐C or DMSO for 24 h. Cells were fixed and prepared for electron microscopy analyses (left panel). Intact mitochondrial cristae were quantified (right panel). Errors bars show the standard deviation (SD) of 3 independent experiments.
- Oxygen consumption rate (Viard et al.) of cells treated with Mito‐C (2, 10 and 20µM) were measured by Seahorse© technique. Measurements start before starting the treatment, arrow indicates the Mito‐C injection. Graphs show the standard deviation (SD) of 3 independent experiments.
- To evaluate the mitochondrial potential, cells were treated with Mito‐C for 24 h at the indicated range of concentrations and stained with MitoTracker Redox and analyzed by cytometry. Graphs show the standard deviation (SD) of 3 independent experiments.
- To evaluate the mitochondrial potential, cells were treated with Mito‐C at 2 µM over a time course and then stained with MitoTracker Redox and analyzed by cytometry. Graphs show the standard deviation (SD) of 3 independent experiments.
- To evaluate the total mitochondrial mass over a time course of treatment, HeLa cells were treated with DMSO or Mito‐C at 2 µM for the time duration indicated, stained with MitoTracker green and analyzed by cytometry. Graphs show the standard deviation (SD) of 3 independent experiments.
- To evaluate the total mitochondrial mass at a fixed time point following treatment with an increasing range of concentrations of Mito‐C cells were treated with DMSO or Mito‐C for 24 h at concentration indicated, stained with MitoTracker green and analyzed by cytometry. Graphs show the standard deviation (SD) of 3 independent experiments.
- High‐resolution respirometry (HRR) evaluation of HeLa cells treated for 15 min with 2 µM Mito‐C. Different bioenergetics parameters were analyzed: routine respiration, oligomycin‐sensitive, and CCCP‐sensitive. The term "routine" respiration is defined as the respiratory rate of intact cells measured in 5 mM glucose DMEM under atmospheric conditions at 37°C and sensitive to 2.5 µM antimycin A inhibition. The term "oligo insensitive" respiration is the respiratory rate measured in the routine conditions after addition of the F1F0‐ATP synthase inhibitor oligomycin at 20 µg/ml. This "oligomycin" state of respiration does not depend on ADP phosphorylation. The ATP‐linked respiration is calculated as the difference between the routine and the oligomycin‐sensitive. The term "uncoupled" respiration defines the rate of respiration measured in the "oligo" conditions after addition of the uncoupler CCCP used at 2 µM. The "CCCP" state allows evaluating the maximal capacity of the respiratory chain in presence of energy substrates and oxygen concentration as defined in the "routine" conditions. The ATP‐linked respiration (routine‐oligo) indicates the part of respiration used for ATP synthesis and the spare respiratory capacity (CCCP‐routine) gives a measure of the capacity of the respiratory chain to be chemically uncoupled. It indicates how far from the maximal capacity the routine respiration operates. Bars show the standard deviation (SD) of 3 independent experiments.
- Comparison of cell viability from HeLa cells grown on high glucose (25 mM) (open bar) versus cells grown on galactose (10 mM) (solid bar) treated with 2 µM Mito‐C for 24 h. Data are expressed as mean ± SEM of N = 3 biological replicates.
Data information: For evaluating significance of differences observed in A, t‐test was used (*** indicates P < 0.0001). Scale bar in A = 200 nm.