
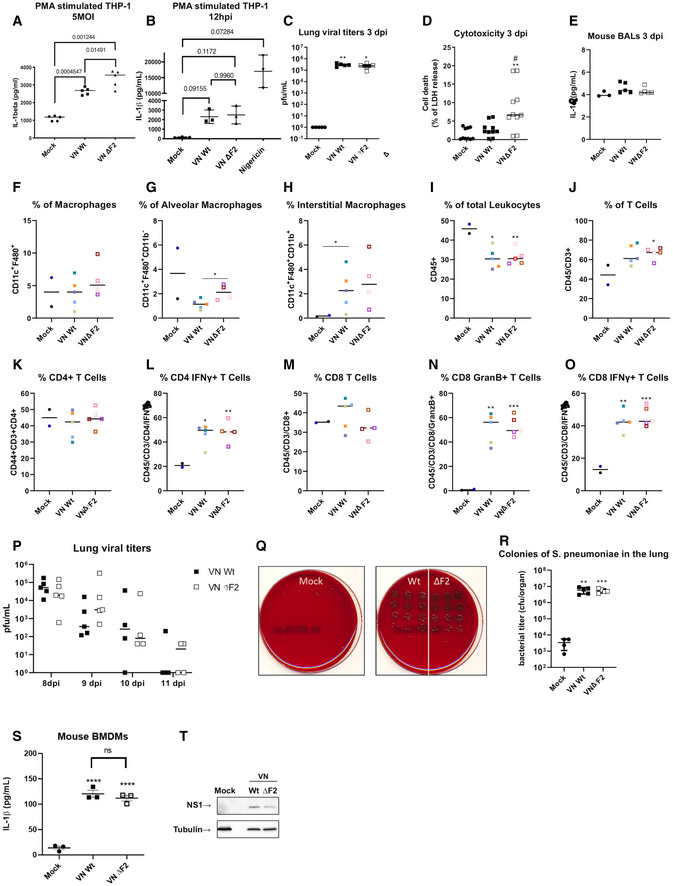
Figure EV1. Contemporary IAV strains lacking PB1‐F2 do not display an in vivo phenotype in mice or murine cells.
-
ATHP‐1‐derived macrophages were infected with the wild‐type (Wt) and ΔF2 H5N1 (VN) virus at MOI 5 for 24 h. Levels of IL‐1β were measured by ELISA. The mean ± standard deviation of five independent experiments is shown. Statistical analysis was performed by one‐way ANOVA, and P‐values are indicated.
-
BTHP‐1‐derived macrophages were infected with the wild‐type (Wt) and ΔF2 H5N1 (VN) virus at MOI 10 for 12 h. Levels of IL‐1β were measured by ELISA. The mean ± standard deviation of three independent experiments is shown. Statistical analysis was performed by one‐way ANOVA, and P‐values are indicated.
-
CLung viral loads from 5 individual mice on day 3 post‐infection were assessed by plaque assay on MDCK cells. Median titers are indicated Statistical analysis was performed by Student’s t‐test as compared to mock samples (*P < 0.05, **P < 0.01).
-
DGroups of n = 5 mice were mock treated or infected with 40 pfu of the VN Wt or VN ΔF2 strains for 3 days. LDH assay was performed on BAL samples in technical duplicates (# P < 0.05 compared with wt **P < 0.01 compared with mock).
-
EELISA for IL‐1β in BALF of mock (n = 3), VN Wt (n = 5) or VN ΔF2 (n = 5) infected mice.
-
F–OGroups of mice were mock treated (n = 2) or infected with 40 pfu of the VN Wt (n = 5) or VN ΔF2 (n = 4–5, of note for F–H the staining for macrophages for the red sample failed due to technical problems and is not indicated) for 7 days. Flow cytometry data for indicated cell populations. Statistical analysis was performed by one‐way ANOVA, and P‐values are indicated. (*P < 0.05, **P < 0.01, ***P < 0.001).
-
PGroups of n = 3–5 mice were infected with 40 pfu of the VN Wt or VN ΔF2 strains for 8–11 days. Lung viral loads were assessed by plaque assay on MDCK cells.
-
QStreptococcus pneumoniae colonies in serial dilutions of lung homogenate are shown in trypcase soy agar +5% sheep blood plates. Representative results are shown in technical triplicates
-
RStreptococcus pneumoniae bacteria in the lungs (cfu/organ) 24 h post‐infection from mock treated, VN Wt or VN ΔF2 pre‐infected animals (mock n = 4, virus infected n = 5). Median values ± SD are indicated. Statistical analysis was performed by one‐way ANOVA P‐values toward mock samples are indicated. (**P < 0.01, ***P < 0.001).
-
SELISA for IL‐1β secretion in BMDMs (n = 3) mock treated of infected with VNWt and ΔF2 strains. Statistical analysis was performed by one‐way ANOVA, and P‐values are indicated. Median values ± SD are indicated. P‐values toward mock samples are indicated. (****P < 0.0001).
-
TImmunoblot of cell lysates from (S). For all panels, the median of the indicated independent experiments is shown.
Source data are available online for this figure.