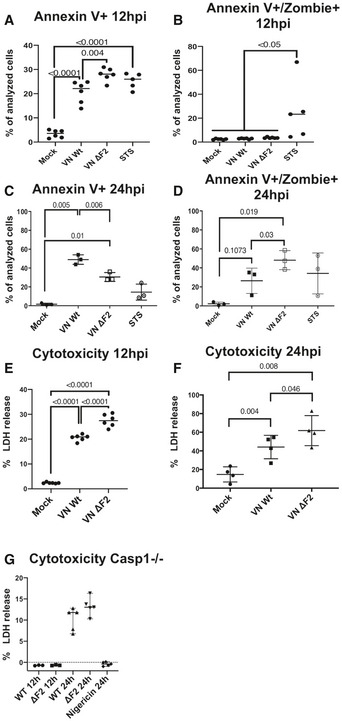
Figure 2. Expression of H5N1 PB1‐F2 delays pyroptotic cell death.

-
A–DTHP‐1 cells were infected with the wild‐type (Wt) and ΔF2 H5N1 (VN) virus at MOI 10. Flow cytometry results for annexin V single positive (A and C) and annexin V and zombie dye double positive (B and D) cells. The percentage of positive cells are depicted at 12 hpi or 24 hpi.
-
E, FTHP‐1 cells were infected with the wild‐type (Wt) and ΔF2 H5N1 (VN) virus at MOI 10. LDH release measured from supernatants of mock treated or infected cells at 12 hpi (E) or 24 hpi (F).
G THP‐1 Caspase 1−/− cells were infected with the wild‐type (Wt) and ΔF2 H5N1 (VN) virus at MOI 10. LDH release measured from supernatants of mock treated or infected cells at 12 hpi or 24 hpi. n = 3 for 12 hpi, n = 5 for 24 hpi. Medians are indicated, and statistical analysis was performed by one‐way ANOVA.
Data information: Mean values of n = 3 independent experiments measured in technical duplicates are indicated (A, B, and E) or n = 3 independent experiments for (C and D) or n = 4 independent experiments for (F). Statistical analysis was performed by one‐way ANOVA, and P‐values are indicated.
