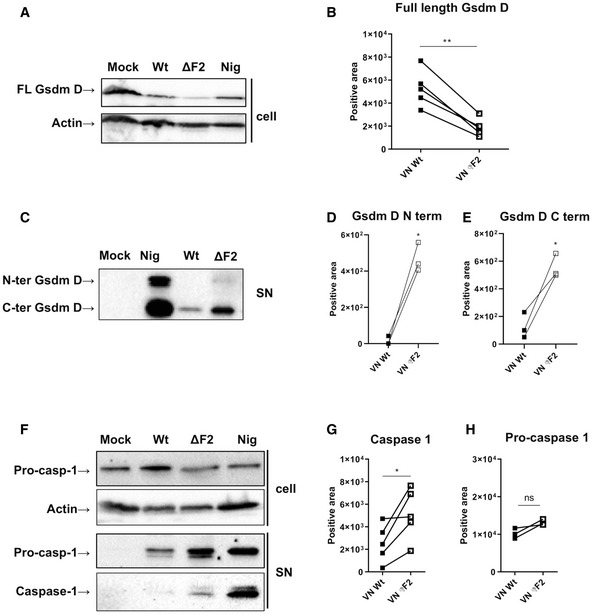
Figure 3. The PB1‐F2 null mutation amplifies NLRP3‐dependent inflammasome activation in H5N1 infected cells.

- THP‐1 cells infected with VN Wt and ΔF2 virus at a MOI 10 for 24 h or treated with 6.7 μM of nigericin (nig) for 45 min were analyzed by immunoblotting. Detection of the full‐length gasdermin D. Equal loading was confirmed by beta actin. One representative blot of five independent repeats is shown.
- Quantification of band intensity for the gasdermin D full‐length isoform. The mean ± standard deviation five independent experiments is shown. Statistical analysis was performed by the paired two‐tailed Student’s t‐test. The asterisk (*) marks a significant difference when compared to the mock group **P < 0.01.
- THP‐1 cells infected with VN Wt and ΔF2 virus at a MOI 10 for 24 h or treated with 6.7 μM of nigericin (nig) for 45 min were analyzed by immunoblotting. Detection of cleaved gasdermin D N‐terminal and C‐terminal isoforms by immunoblot in supernatants; one representative experiment of three independent repeats is shown.
- Quantification of band intensity for N‐terminal gasdermin D isoform band. Three independent experiments are shown. Statistical analysis was performed by the paired two‐tailed Student’s t‐test. *P < 0.05.
- Quantification of band intensity for C‐terminal gasdermin D isoform band. Three independent experiments are shown. Statistical analysis was performed by the paired two‐tailed Student’s t‐test. *P < 0.05.
- THP‐1 cells infected with VN Wt and ΔF2 virus at a MOI 10 for 24 h or treated with 6.7 μM of nigericin (nig) for 45 min were analyzed by immunoblotting. Pro‐caspase‐1 and active caspase‐1 were detected by immunoblot in cell lysates (cell, upper panels) and supernatants (sup, lower panels) from the same experiment. One representative experiment of three independent repeats is shown.
- Quantification of band intensity for active caspase‐1 band. Five independent experiments are shown. Statistical analysis was performed by the paired two‐tailed Student’s t‐test. *P < 0.05.
- Levels of total pro‐caspase‐1 were quantified on pellets and respective supernatants. Three independent experiments are shown. Statistical analysis was performed by the paired two‐tailed Student’s t‐test.
Source data are available online for this figure.
