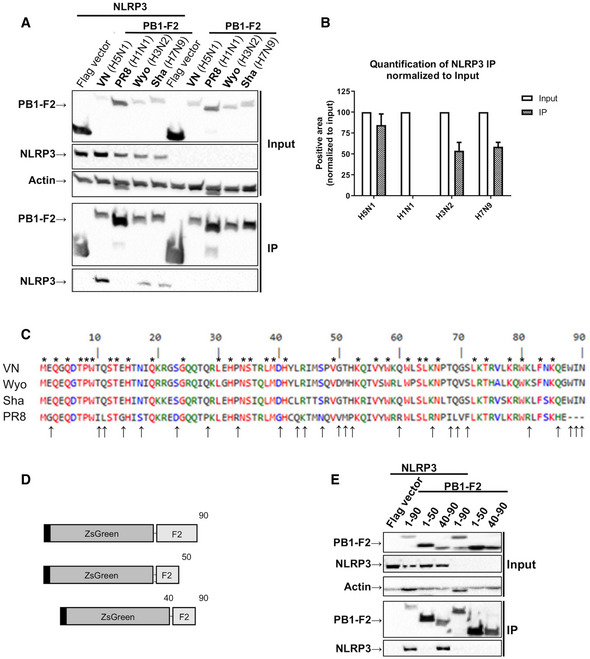
Figure 4. PB1‐F2 interacted with NLRP3 in a strain‐dependent manner.

- Western blot analysis of whole cell lysate (input) and Flag‐specific immunoprecipitation (IP) from 293T cells co‐transfected with expression plasmids encoding V5‐NLRP3 and Flag ZsGreen‐PB1‐F2 from indicated viral strains for 24 h. Representative blot of three independent repeats is shown.
- Quantification of the NLRP3 IP band was normalized to the respective NLRP3 input band (n = 3 independent biological replicates, normalized to the respective input). Mean values ± SD are indicated.
- Alignment of PB1‐F2 sequence from two avian IAV strains (VN (H5N1) and Sha (H7N9)) and two mammalian/human IAV strains (PR8 (H1N1) and Wyo (H3N2)) (Combet et al, 2000). * above the sequence shows a conserved amino acid between the four strains while ↑ on the bottom shows a different amino acid for PR8 in comparison with the other strains.
- Schematic diagrams showing the truncated versions of Flag ZsGreen PB1 F2 used in (E) (not to scale).
- 293T cells co‐transfected with expression plasmids encoding different truncation mutants for Flag Zsgreen‐PB1‐F2 from VN (H5N1) and V5‐NLRP3 were processed as described in (A). Representative blot of three independent repeats is shown.
Source data are available online for this figure.
