
Figure 1. Invasive bacterial isolates and resistance development over time in the European Union (EU) and European Economic Area (EEA).
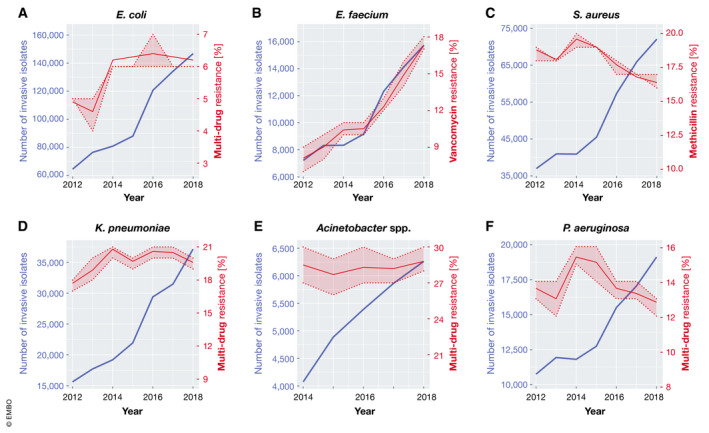
(A) Total number of invasive E. coli isolates tested and percentage with combined resistance to fluoroquinolones, 3rd‐generation cephalosporins and aminoglycosides, including 95% confidence intervals (95% CI, shaded area). (B) Total number of invasive E. faecium isolates tested and percentage with resistance to vancomycin, including 95% CI. (C) Total number of invasive S. aureus isolates tested and percentage with resistance to methicillin (MRSA), including 95% CI. (D) Total number of invasive K. pneumoniae isolates tested and percentage with combined resistance to fluoroquinolones, 3rd‐generation cephalosporins and aminoglycosides, including 95% CI. (E) Total number of invasive Acinetobacter spp., including most of the disease‐causing species (A. baumannii, A. pittii and A. nosocomialis) and the generally less pathogenic A. non‐baumannii group, isolates tested and percentage with combined resistance to fluoroquinolones, aminoglycosides and carbapenems, including 95% CI. (F) Total number of invasive P. aeruginosa isolates tested and percentage with combined resistance (resistance to three or more antimicrobial groups among piperacillin—tazobactam, ceftazidime, fluoroquinolones, aminoglycosides and carbapenems), including 95% CI. (A‐F) Data are derived from European Centre for Disease Prevention and Control’s yearly Surveillance of antimicrobial resistance in Europe (reports 2013‐2018 were used). ECDC collects data from invasive isolated reported to the European Antimicrobial Resistance Surveillance Network (EARS‐Net) by 30 EU and EEA (Iceland and Norway) countries.