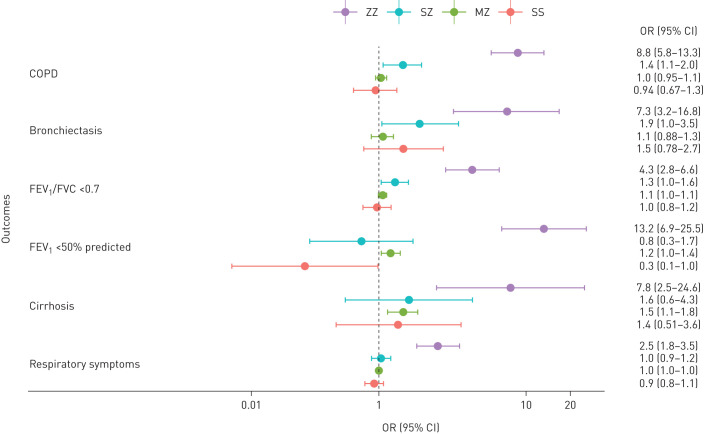
FIGURE 3.
Forest plot of associations between SERPINA1 genotypes and common conditions. Odds ratios were calculated by logistic regression models compared to PI*MM (wild-type) genotype adjusted for age, sex, genotyping array, assessment centre and the first five genetic principal components. FEV1: forced expiratory volume in 1 s; FVC: forced vital capacity.

