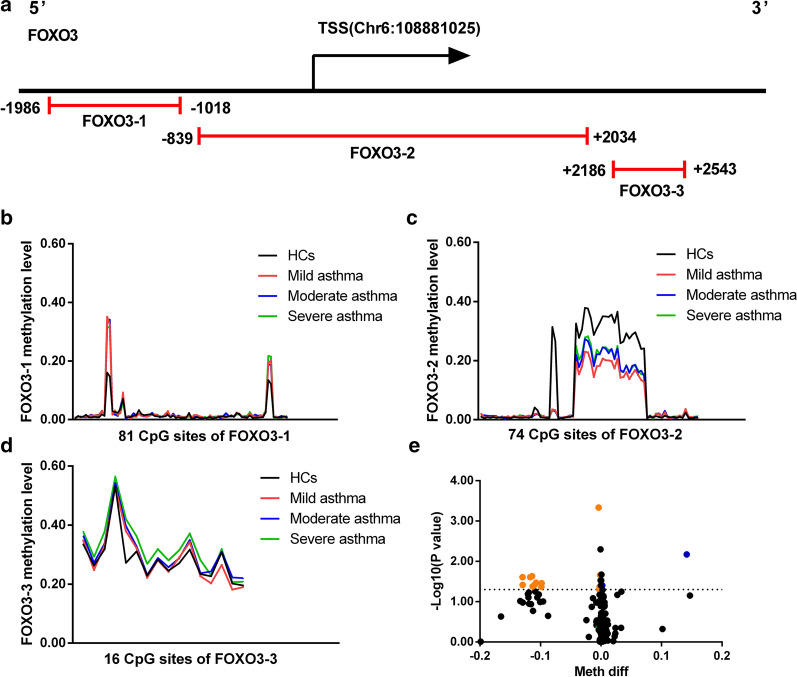
Fig. 2.
Variable DNA methylation of FOXO3 gene’s CpG islands in LOA. a Schematic representation of CpG islands sequenced FOXO3. CpG islands are indicated in Red lines. The Range of each islands is indicated by its relative distance (in bp) to TSS; b–d Mean DNA methylation level of the three CpG islands (FOXO3-1, FOXO3-2, FOXO3-3) are presented from LOA patients and HCs, respectively; e Volcano plot of DMSs in FOXO3 between LOA patients and HCs. The up-regulated sites were presented as blue dots and down-regulated sites were presented as orange dots

