
Figure 1.
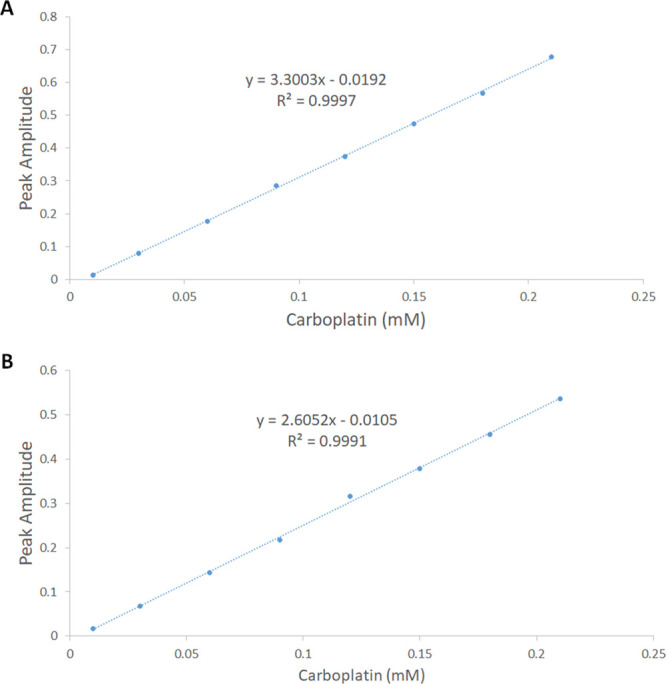
Plot of peak amplitudes at 266 nm obtained from the mixtures containing consecutively increasing concentrations of carboplatin (0.01–0.21 mM) and a fixed concentration of (A) 0.2 mM PS4 and (B) 0.2 mM PS6.
Official websites use .gov
A
.gov website belongs to an official
government organization in the United States.
Secure .gov websites use HTTPS
A lock (
) or https:// means you've safely
connected to the .gov website. Share sensitive
information only on official, secure websites.
Plot of peak amplitudes at 266 nm obtained from the mixtures containing consecutively increasing concentrations of carboplatin (0.01–0.21 mM) and a fixed concentration of (A) 0.2 mM PS4 and (B) 0.2 mM PS6.