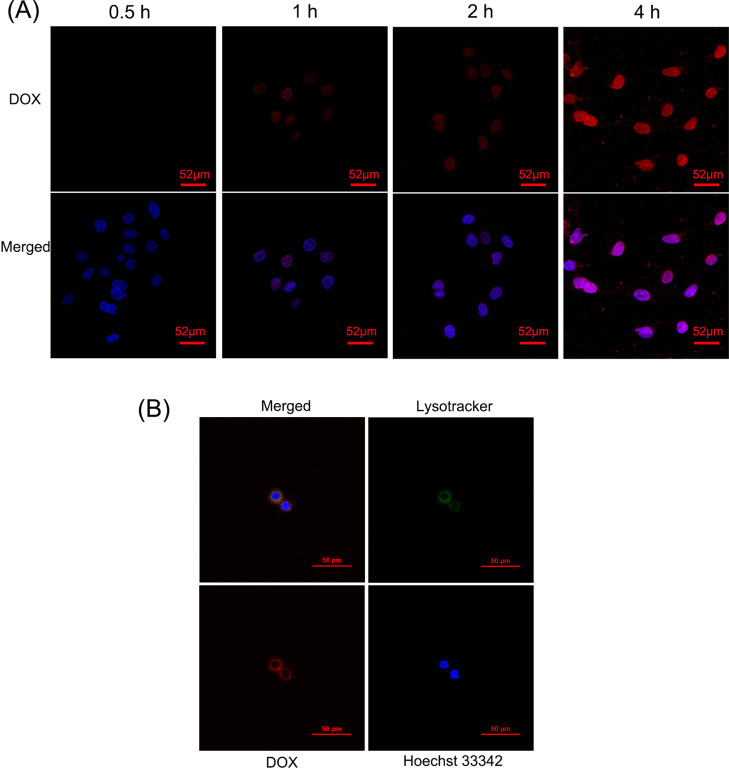
Figure 3.
(A) Confocal imaging (×400) of cellular uptake and cellular drug release course in AGS cells incubated with AS1411-based nanoparticles for different time periods. The fluorescence signal is represented by DOX (red) or DAPI (blue). (B) Colocalization confocal imaging (×600) of AS1411-based nanoparticles in AGS cells. The fluorescence signal represented the colocalization overlap color (yellow), Lysotracker (green), DOX (red), or Hoechst 33342 (blue).

