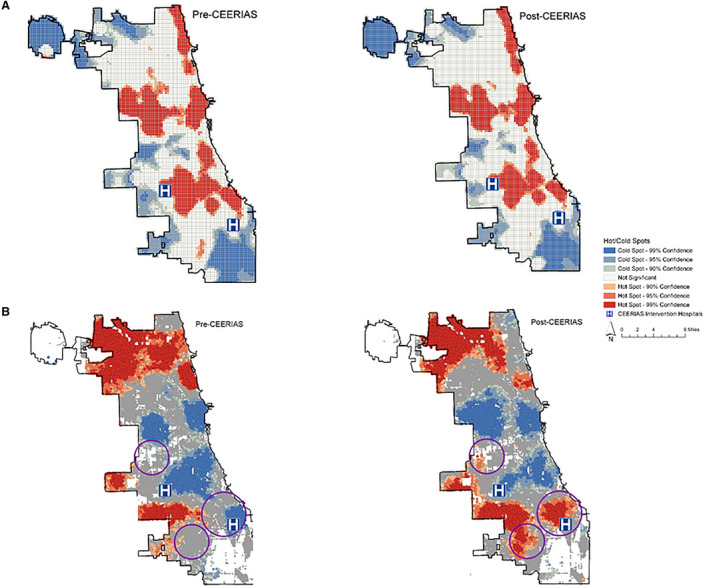
Figure 2. Geographic information system analysis of effect of intervention on secondary outcomes in Chicago before and after intervention; statistical hot and cold spots are defined as areas where there is <1% likelihood that case clusters occur by chance alone.

A, Overall EMS utilization; B, EMS utilization for suspected stroke (purple circles indicate geocoded regions where cold spots became hot spots after the intervention). CEERIAS indicates Community Engagement for Early Recognition and Immediate Action in Stroke.
