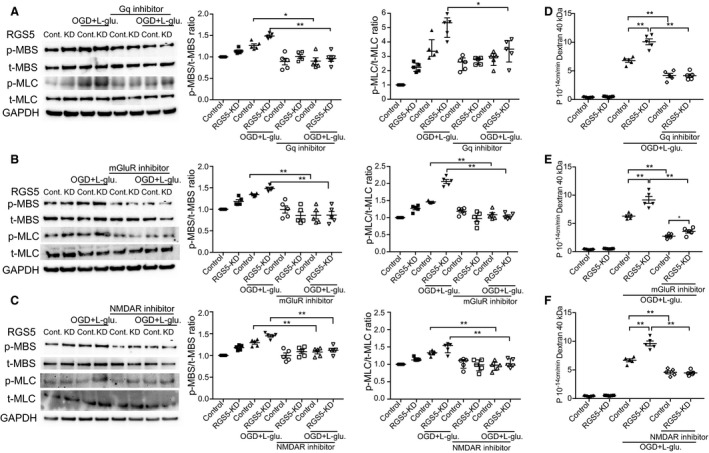
Figure 5. Effect of regulator of G‐protein signaling 5 knockdown (RGS5‐KD) on actin cytoskeleton reorganization and cellular permeability during oxygen glucose deprivation and l‐glutamate stimulation (OGD+l‐glutamate; 1 mmol/L for 3 hours) and reperfusion treatment.

Western blotting analysis of myosin phosphatase target subunit 1 (MBS) and myosin light chain 2 (MLC2) phosphorylation, before and after treatment with Gq inhibitor (10 μmol/L; YM254980) (A), metabotropic glutamate receptor (mGluR) inhibitor (10 mmol/L; JNJ16259685) (B), and ligand‐gated ionotropic glutamate receptor (NMDAR) inhibitor (10 mmol/L; MK‐801) (C). Cell permeability, as determined by fluorescein isothiocyanate–labeled dextran 40 kDa in the presence or absence of Gq inhibitor (D), mGluR (E), or NMDAR inhibitor (F). n=5 for all above experiments. Normally distributed data sets used 2‐way ANOVA (variables, treatment groups and control vs RGS5‐KD) followed by post hoc Tukey tests, whereas nonnormally distributed data sets used Kruskal‐Wallis tests. *P<0.05, **P<0.01.
