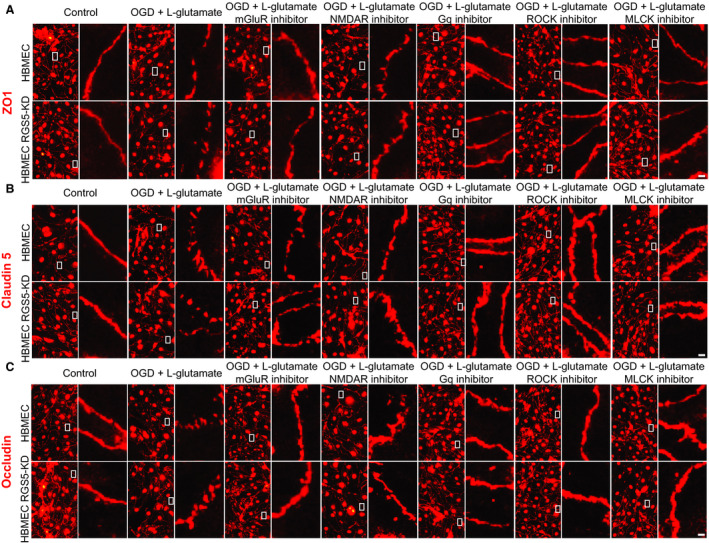
Figure 6. Effect of regulator of G‐protein signaling 5 knockdown (RGS5‐KD) on brain endothelial tight junction proteins.

A through C, Immunofluorescent staining of tight junction proteins, zonula occludens 1 (ZO1), occluding, and claudin‐5 before after stimulation with oxygen glucose deprivation and l‐glutamate treatment (OGD+l‐glutamate; 1 mmol/L for 3 hours), with and without metabotropic glutamate receptor inhibitor (10 mmol/L; JNJ16259685), ligand‐gated ionotropic glutamate receptor inhibitor (10 mmol/L; MK‐801), Gq inhibitor (10 μmol/L; YM254980), Rho‐associated kinase (ROCK) inhibitor (Y‐27632; 20 μmol/L), or myosin light chain kinase (MLCK) inhibitor (ML‐7; 10 μmol/L) (n=5). Bar=10 μm.
