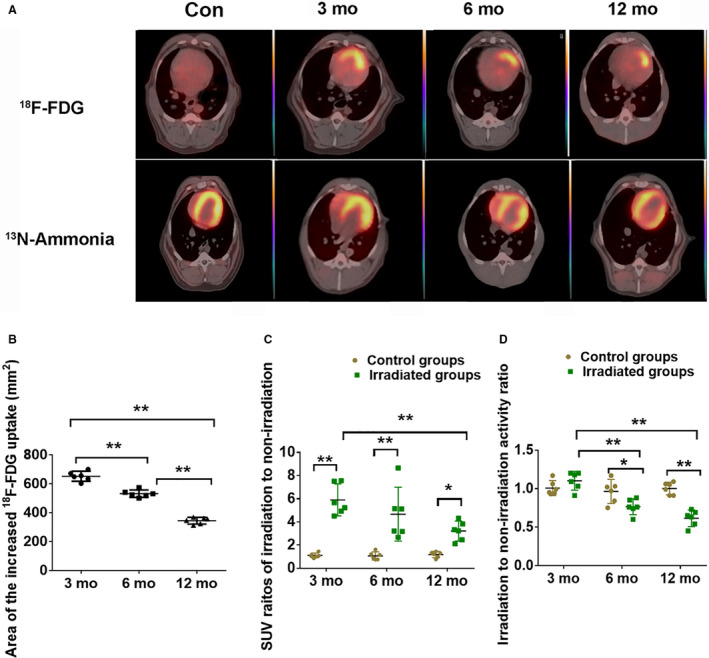
Figure 2. 18F‐FDG and 13N‐ammonia PET/CT infused images of each group and parameters of PET/CT.

A, Focal increased 18F‐FDG uptake occurred in the irradiated field (upper panel), 13N‐ammonia uptake in the irradiated field decreased at month 6 after radiation and disappeared at month 12 after radiation (bottom panel). B, Area of increased 18F‐FDG uptake. C. Standardized uptake value ratios of irradiation to nonirradiation of 18F‐FDG PET/CT. D, Irradiation:nonirradiation activity ratio of 13N‐ammonia PET/CT. Data are mean with 95% confidence, *P<0.05, **P<0.01. Con indicates control; 18F‐FDG, 18F‐fludeoxyglucose; PET/CT indicates positron emission tomography/computed tomography; and SUV, standardized uptake value.
