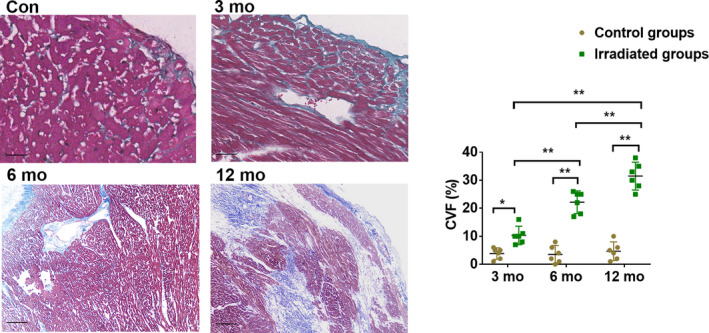
Figure 6. The Masson staining images and CVF of the irradiated myocardium of each group.

Blue staining of collagen fibers were gradually intensified over time. Scale bar = 100 μm, data are mean with 95% confidence, *P<0.05, **P<0.01. Con indicates control; and CVF, collagen volume fraction.
