
Figure 1.
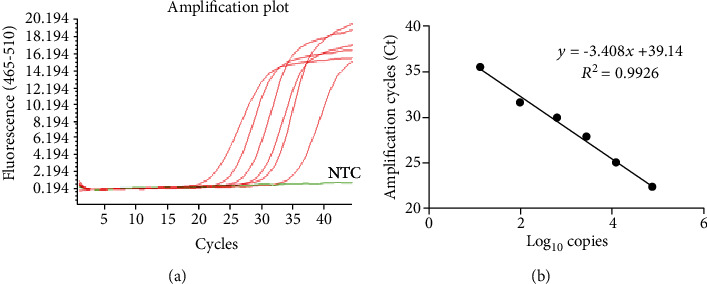
Standard curve made by diluting the SARS-CoV-2-positive control. (a) Shows data from 7 serial dilutions (100%, 20%, 10%, 2%, 1%, 0.5%, and 0.1%) of the SARS-CoV-2-positive control (PC) supplied with the LightMix® Modular kit evaluated with RT-qPCR. The 0.1% dilution showed no amplification curve as NTC. Panel B shows the standard curve made by the 7 dilutions of the PC. NTC: no template control.