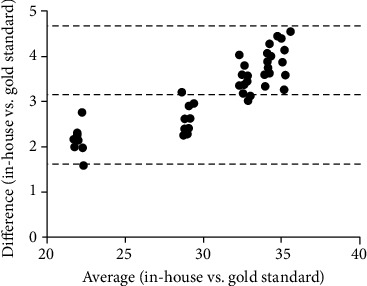
Figure 2.

Agreement between the in-house method and the gold standard. Bland-Altman's diagram shows the difference between the two methods on the y-axis and their average on the x-axis. The bias between the measurements was 3.16 (CI95% 1.62-4.69) with 95% agreement. The dotted lines represent the bias and the upper and lower limits of 95% agreement.
