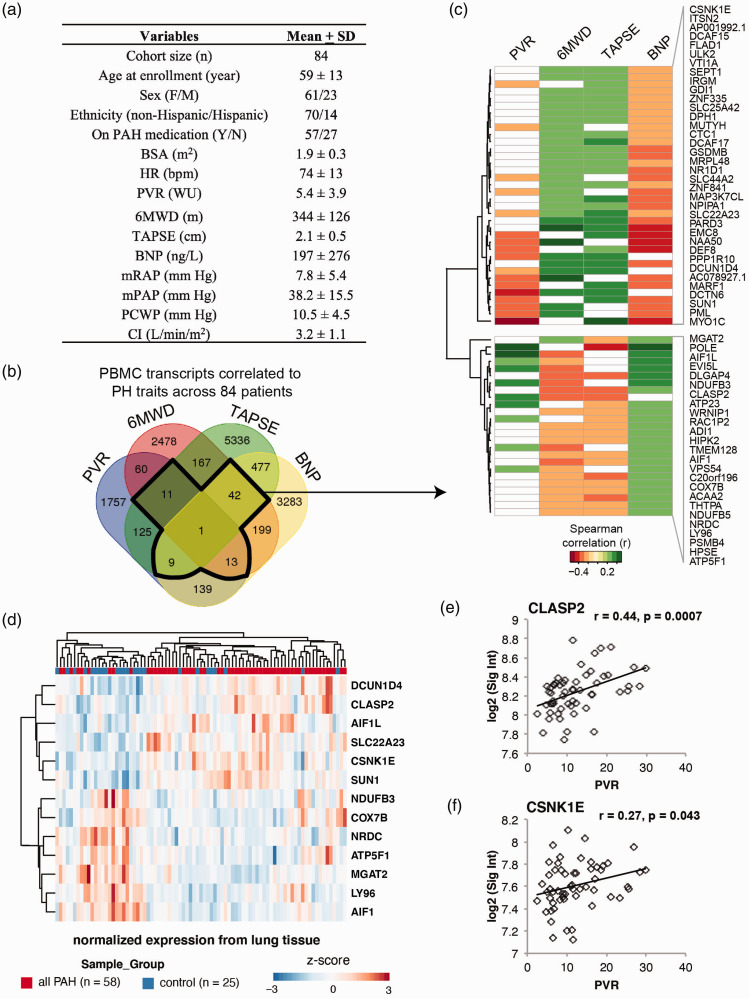
Figure 1.
61-gene signature associated with PAH severity and risk. (a) Table depicts demographic and clinical characteristics of the UA cohort. (b) Venn diagram for the numbers of transcripts shared among four correlation analyses with correlation coefficient r ≥ 0.2 (p < 0.05). A single transcript (ZNF841) shows significant correlation with all four clinical parameters. (c) The heat map depicts correlation coefficients for the 61 genes correlated with PVR, BNP, TAPSE, or 6MWD (r > 0.2, p < 0.05). (d) The heatmap depicts 13 of the 61 genes from the original classifier, which is significantly differentially regulated between lungs of patients with PAH (n = 58) versus non-PAH controls (n = 25). (e and f) Two of the 13 filtered genes in lungs were also significantly correlated with PVR in the Replication cohort (CLASP2, CSNK1E). BSA: body surface area; HR: heart rate; PVR: pulmonary vascular resistance; WU: wood units; 6MWD: six-minute walk distance; TAPSE: tricuspid annular plane systolic excursion; BNP: brain natriuretic peptide; mRAP: mean right atrial pressure; mPAP: mean pulmonary artery pressure; PCWP: pulmonary capillary wedge pressure; CI: cardiac index; PA saturation: pulmonary artery saturation. Descriptive statistics are presented as mean ± SD.

