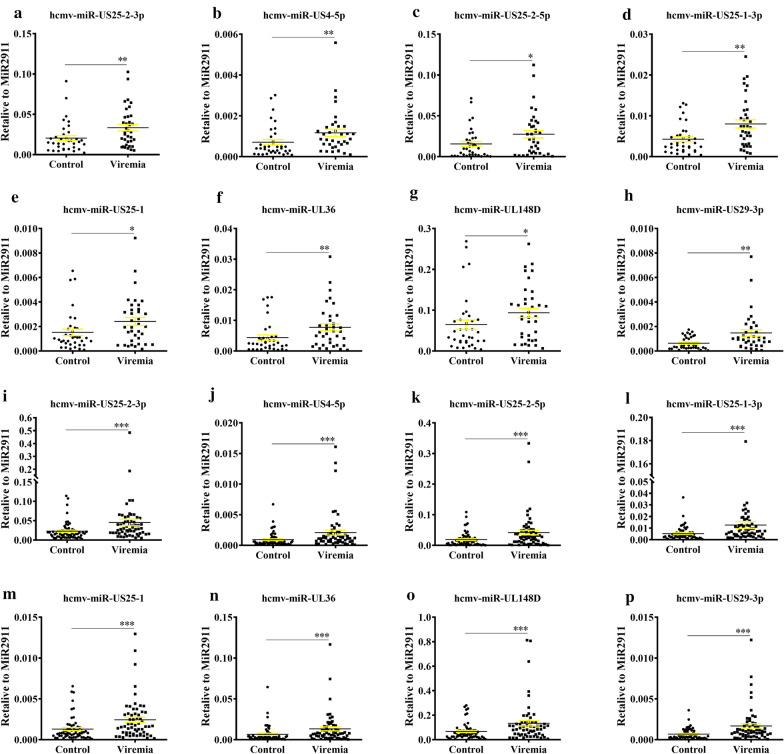
Fig. 2.
Serum levels of the 8 upregulated hcmv-miRNAs in the HCMV viremia patients as compared with control group in the validation set (a–h) and the combination set (i–p). a, i hcmv-miR-US25-2-3p; b, j hcmv-miR-US4-5p; c, k hcmv-miR-US25-2-5p; d, l hcmv-miR-US25-1-3p; e, m hcmv-miR-US25-1; f, n hcmv-miR-UL36; g, o hcmv-miR-UL148D; h, p hcmv-miR-US29-3p. Cq values were converted to relative concentrations normalized to MIR2911 values, and were calculated using the comparative Cq method (2−ΔCq). Each point represents the mean of triplicate sample. ✻, indicates that compared with the control group, P < 0.05; ✻✻,indicates that compared with the control group, P < 0.01; ✻✻✻, indicates that compared with the control group, P < 0.001. P‐values were measured by Mann–Whitney independent t test

