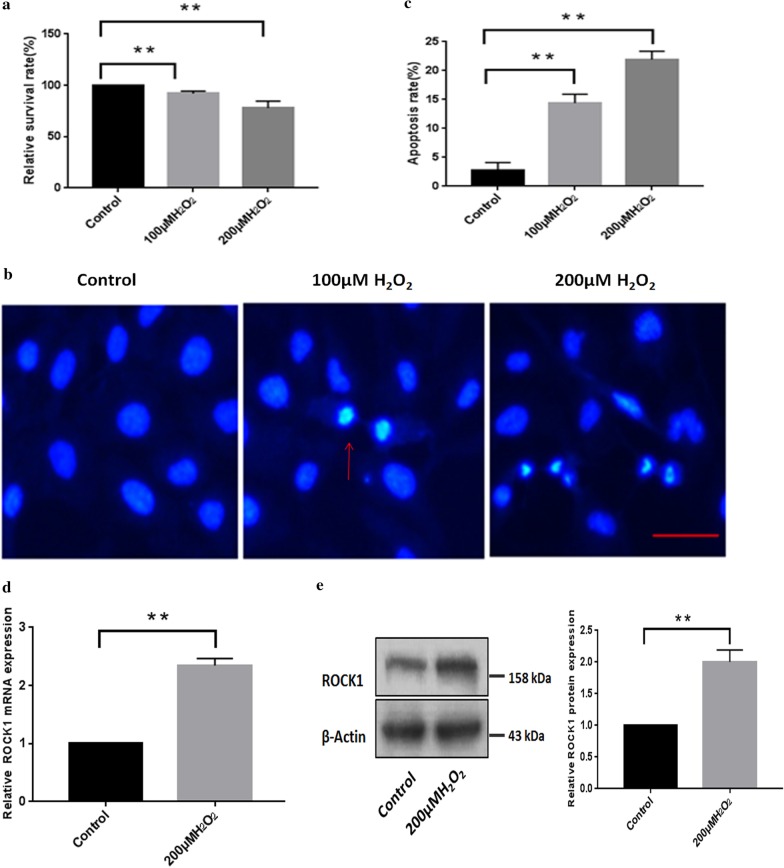
Fig. 4.
Up-regulation of ROCK1 in apoptotic epithelial cells in response to H2O2. a H2O2 inhibited the viability of LECs as measured by the MTT assays. B3 cells were incubated in the absence or presence of different doses of H2O2 (100 and 200 µM) for 24 h, and cell viability was assessed by measuring absorbance at 492 nm with a microplate reader. **p < 0.01 versus the untreated cells. b The apoptosis detection of LECs under different doses of H2O2 (100 and 200 µM) treatment for 24 h by Hoechst 33342 staining assay. The red arrow showed the nuclear morphology stained with blue by using Hoechst 33342. Scale bar: 50 µm. c Apoptosis rates were analyzed after treatment with different doses of H2O2 (100 and 200 µM) treatment. The apoptosis rates, which were calculated based on at least 100 cells from three experiments, **p < 0.01 versus the untreated cells. d The mRNA expression of ROCK1 in B3 cells under 200 µM H2O2 was assessed by quantitative RT-PCR. **p < 0.01 versus the untreated group. e The protein level of ROCK1 increased in lens epithelial cells under 200 µM H2O2 treatment. The 100–250 kDa blot was retained by horizontal shear and incubated with the ROCK1 antibody. The 35–50 kDa blot was retained by horizontal shear and incubated with the β-actin antibody

