Fig. 2.
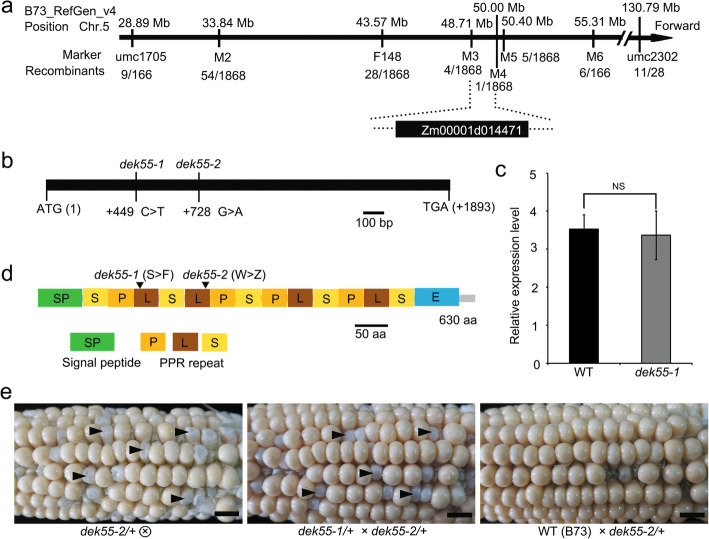
Map-based cloning and identification of DEK55. a Fine mapping of the DEK55 locus. The DEK55 locus was mapped to a 1.29 Mb region between marker 3 (M3) and M4 on chromosome 5, in which there are 25 candidate genes. The physical location of polymorphic molecular markers and the number of recombinants are shown in the schematic diagram. b Schematic structure of the dek55 gene. The mutation sites of dek55–1 and dek55–2 are shown. c Relative expression level of DEK55 in WT and dek55–1 kernels. The values are the means of three biological replicates. The error bars represent the standard deviations. (Not significant (NS); P > 0.05, Student’s t-test). d Schematic diagram of the DEK55 protein, which contains a total of 13 PPR domains (P, L and S) and an E domain. The amino acid changes in dek55–1 and dek55–2 are indicated. e The self-pollinated dek55–2/+ (heterozygote) at 15 DAP, dek55–1/+ and dek55–2/+ were used in an allelism test of dek55. A cross between dek55–2/+ with B73 (WT) was used as a control. Several mutant kernels are indicated by the black arrowheads. Scale bars = 1 cm

