Fig. 6.

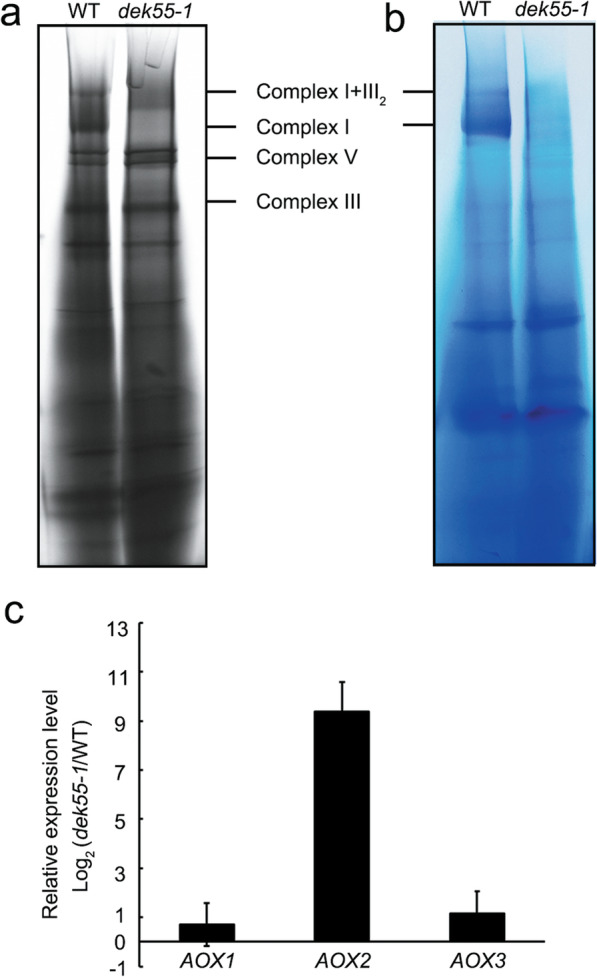
Mitochondrial function was impaired in the dek55–1 mutant. a BN-PAGE analysis of mitochondrial complexes isolated from WT and dek55–1 kernels at 15 DAP. The gels were stained with Coomassie brilliant blue. The positions of the mitochondrial complexes are marked. b In-gel NADH dehydrogenase activity analysis of complex I. The positions of complex I and supercomplex I + III2 are indicated. c qRT-PCR-based analysis of AOX gene (AOX1, AOX2, and AOX3) expression in WT and dek55–1 kernels at 15 DAP. The ZmActin gene (GRMZM2G126010) was used as an internal control. The values shown are the means of three biological replicates, and the error bars represent the standard deviations. The gel images in (a-b) were cropped; the original gel images are shown in Additional file 1: Fig. S4
