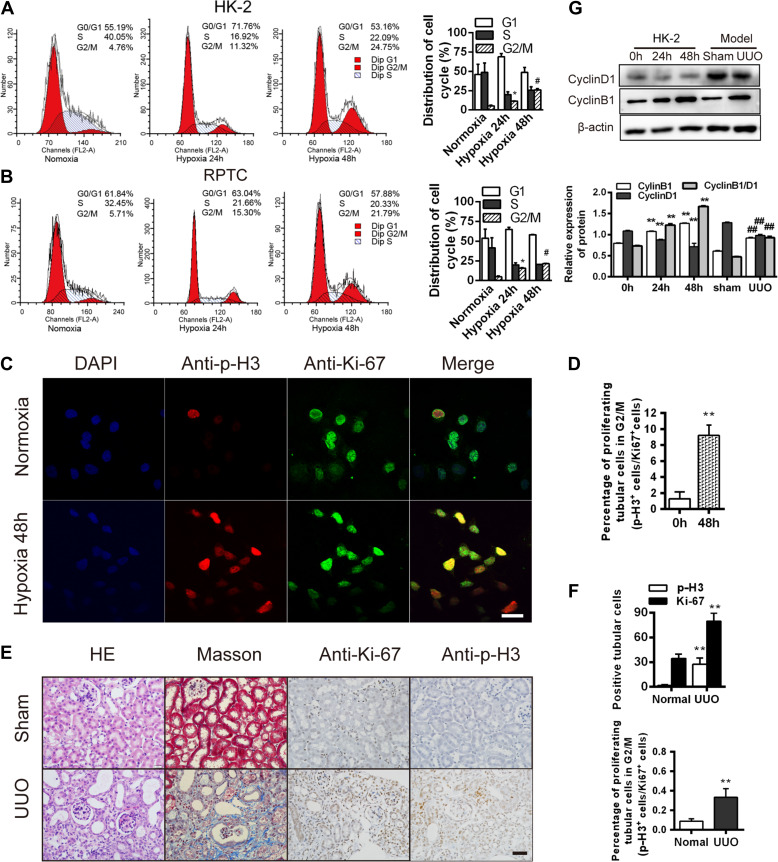
Figure 1.
Hypoxia induces G2/M phase arrest in renal tubular epithelial cells. (A and B) Cell cycle analyses in HK-2 (A) and RPTC (B) at baseline and after hypoxia. Changes in the cell cycle phase percentages are shown (right). (C) Co-staining for p-H3 (red) and Ki-67 (green) in HK-2 cells under hypoxia for 48 h. Scale bar, 10 μm. (D) The p-H3/Ki-67 ratio in the HK-2 cells in C. **P < 0.001 vs. cells under normoxia. (E) HE staining and immunohistochemistry for p-H3 and Ki-67 in sham and UUO kidneys after 14 days. Masson’s trichrome staining shows fibrosis (blue). Magnification, 400×. Scale bar, 50 μm. (F) Numbers (per 400× field) of Ki-67- or p-H3-positive cells (top) and percentages of proliferating cells in G2/M phase (p-H3+ cells/Ki-67+ cells, bottom) in sham and UUO kidneys after 14 days. **P < 0.01. (G) Cyclin D1 and cyclin B1 protein levels in normoxic or hypoxic (24 and 48 h) HK-2 cells and in sham and UUO kidneys 14 days after surgery. **P < 0.001 vs. 0 h. ##P < 0.001 vs. sham. n = 3 in A and B; n = 3 mice/group in E–G. Data are presented as mean ± SEM.

