Figure 6.
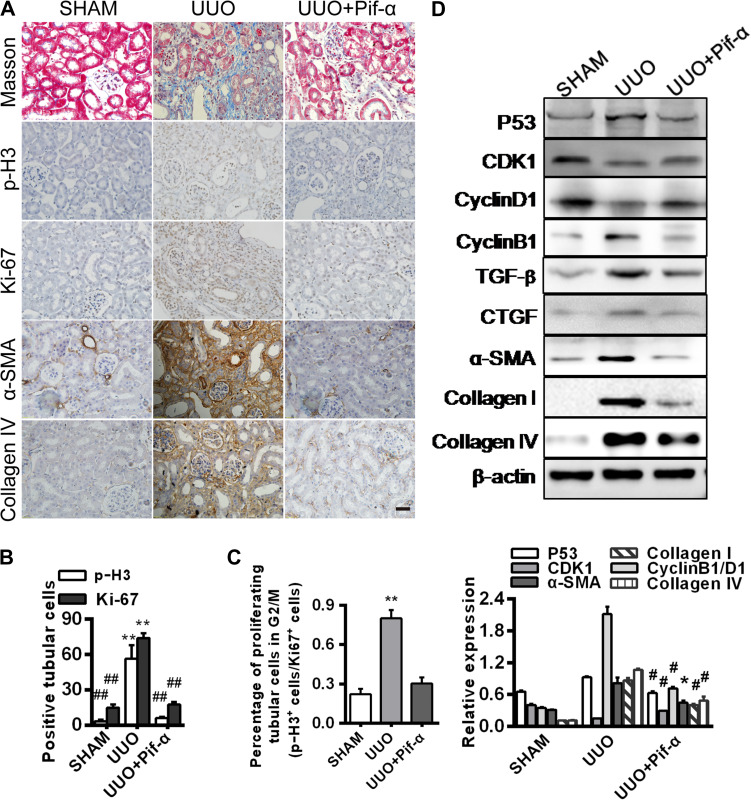
p53 inhibitor prevents hypoxia-induced G2/M arrest and fibrogenesis in vivo. Mouse kidneys were collected 14 days after surgery from three groups: sham, UUO, and UUO with PIF-α treatment on Days 3 and 10. (A) Immunohistochemistry for p-H3, Ki-67, α-SMA, and collagen IV expression. Masson’s trichrome staining shows fibrosis with blue color. Magnification, 400×. Scale bar, 50 μm. (B) Numbers (per 400× field) of Ki-67- or p-H3-positive cells (n = 3 mice in each group). **P < 0.01 vs. sham, ##P < 0.01 vs. UUO. (C) Percentage of proliferating cells in G2/M phase (p-H3+cells/Ki-67+cells). **P < 0.01 vs. sham. (D) Western blotting analyses of p53, CDK1, Cyclin D1, Cyclin B1, TGF-β, CTGF, α-SMA, collagen I, and collagen IV expression (top). The histogram shows relative levels normalized to β-actin (bottom). *P < 0.05, #P < 0.001 vs. sham. Error bars represent SD.

