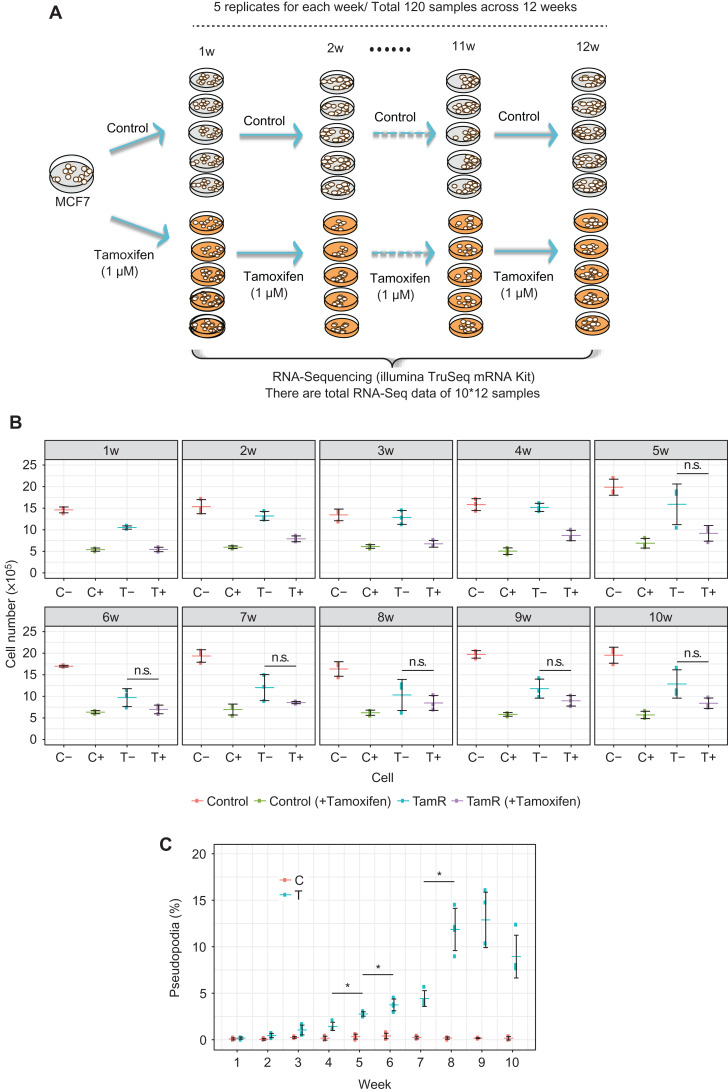
Figure 2.
Resistance acquisition and mRNA sequence data with long-term tamoxifen treatment of MCF-7 breast cancer cells. (A) MCF-7 cells were continually treated with tamoxifen for 12 weeks, with five biological replicates for each week. As controls, tamoxifen-untreated MCF-7 cells are cultured for 12 weeks, with five biological replicates for each week. RNA Sequencing was used to characterize gene expression patterns in 60 tamoxifen-treated samples and 60 control samples in this work. (B) Cell proliferation assay of parental control and TamR cells. Cells were grown in the media in the presence or absence of 1 μM tamoxifen. The significance of the growth inhibitory effect of tamoxifen was calculated with Welch’s test. Symbol * shows significant difference between the values with and without re-administration of tamoxifen at the same time points (P-value <0.05). (C) Cell transformation assay. The number of cells with elongated edges (pseudopodia) was counted. The percentage of the cells with pseudopodia in the total cell numbers was calculated. Symbol * indicates significant difference in the numbers of pseudopodia compared with the prior time point (P-value <0.05, Weltch’s test). Clearly, there are significant differences after the 5th week between TamR(−) and TamR(+), which indicates the phenotypic change or the tipping point around the 5th week for the tamoxifen resistance.

