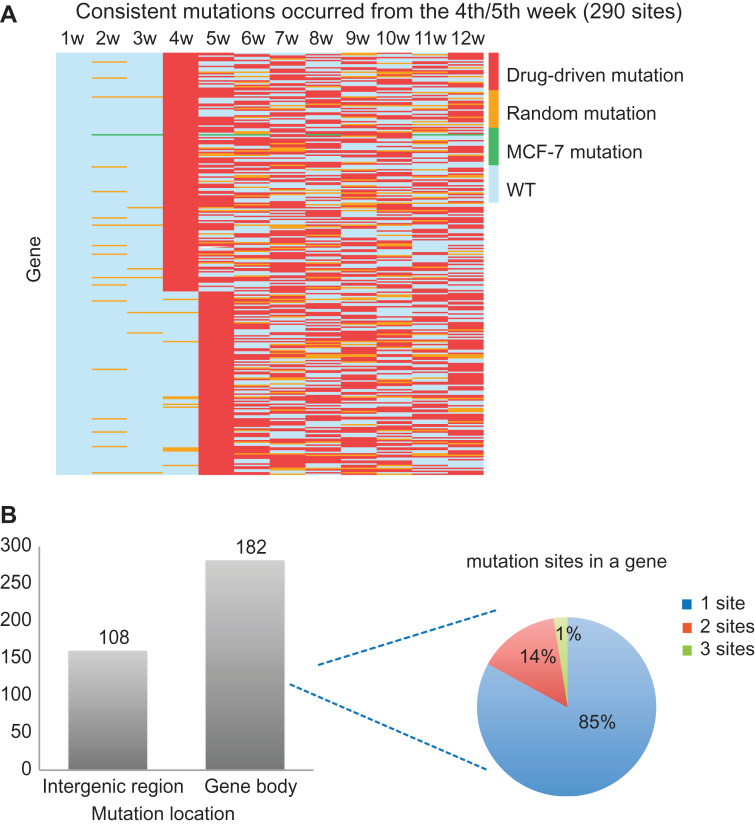
Figure 5.
Drug resistance-associated mutations. (A) Drug-driven mutations consistently existing from the 4th/5th week that may confer drug resistance, sorted by mutation occurrence time. Each row in the heatmap represents a specific mutation site, and each column represents a week. (B) The genome location of these mutations and their distribution in gene: 108 mutations are in the intergenic region, and 182 mutations are in the gene body region covering 157 genes; 85%, 14%, or 1% of genes contain one, two, or three mutations, respectively.

