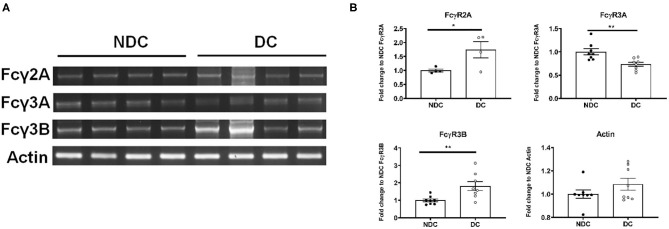
Figure 2.
Subtypes of Fcγ receptors are transcribed in NDC and DC. NDC and DC were kept at basal conditions as described in Figure 1. Cells were lysed, and RNA was extracted. Total RNA was then subject to reverse transcriptase to generate cDNA, and it subsequently amplified by PCR with FcγR2A, FcγR3A, FcγR3B, and actin primers. All amplified samples (FcγR2A = 3,894 base pairs (bp), FcγR3A = 81 bp, FcγR3B = 1,631 bp, Actin = 189 bp. were run on a 2% agarose gel and imaged for quantification and analysis. (A) Shows representative mRNA expression of indicated genes on an agarose gel. (B) Shows quantification of those gels. DC expressed more of FcγR2A (74% increase, *p < 0.05, n = 4, Students t-test, two-way) and FcγR3B (82% increase, **p < 0.01, n = 8, Students t-test, two-way) but less of FcγR3A (27% reduction, **p < 0.01, n = 8, Students t-test, two-way), compared to NDC. Actin was unchanged between the cell models. All scatter plots are mean ± SEM.

