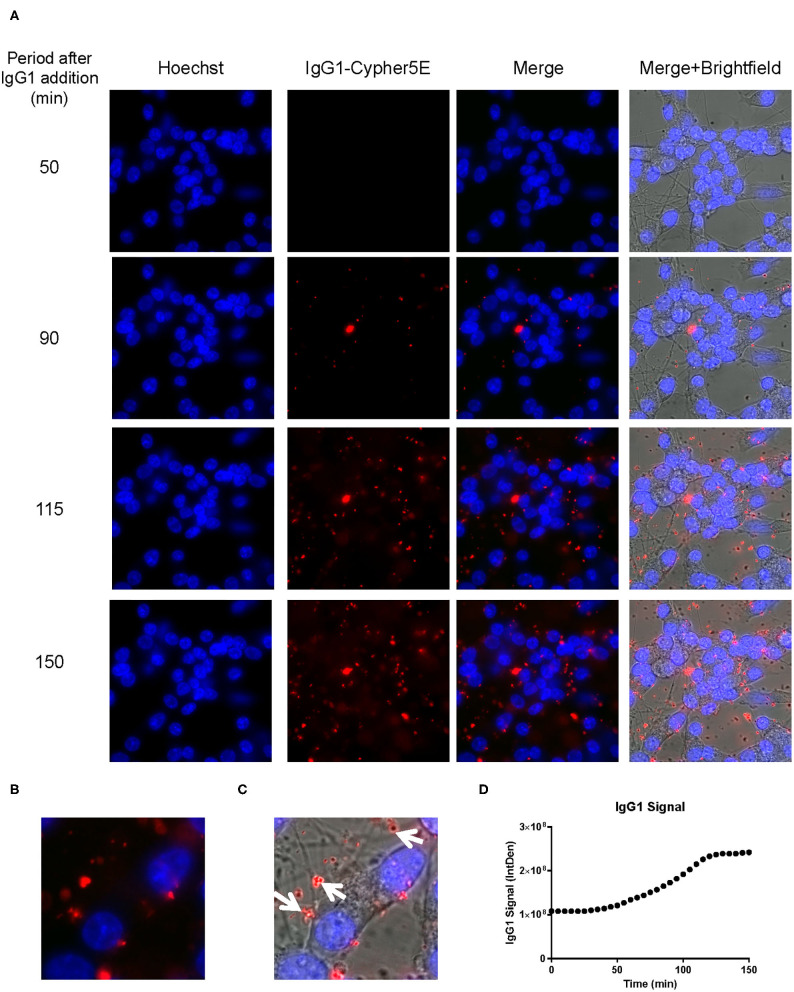
Figure 7.
IgG1 antibody is time-dependently taken up into the neurites of DC. Prior to imaging, DC were incubated with a nuclear stain, Hoechst, washed, and then placed in non-phenol red DMEM with HEPES. Subsequently, DC were treated with 20 μg/mL Cypher5E-tagged IgG1 antibody for up to 150 min. Cells were analyzed using live time-lapse imaging at 5 min intervals. Time points for analyses were chosen from the first time point with positive antibody signal. (A) Shows representative still images from the live imaging from the 50 to 150 min time points, with all analyzed channels. The IgG1-Cypher5E signal increases over time. (B,C) The 150 min Merge + Brightfield images were magnified to show more detailed morphology and localization of 4E6 tau antibody in the cells. The greater majority of the antibody signal was localized in the neurites of the cells as indicated by the white arrows. (D) Quantification of the IgG1 antibody signal from the Cy5 channel from the Internal Density (IntDen) of the entire frame from 0 to 150 min. The IgG1 signal increased over time, and plateaued near 120 min.

