Figure 8.
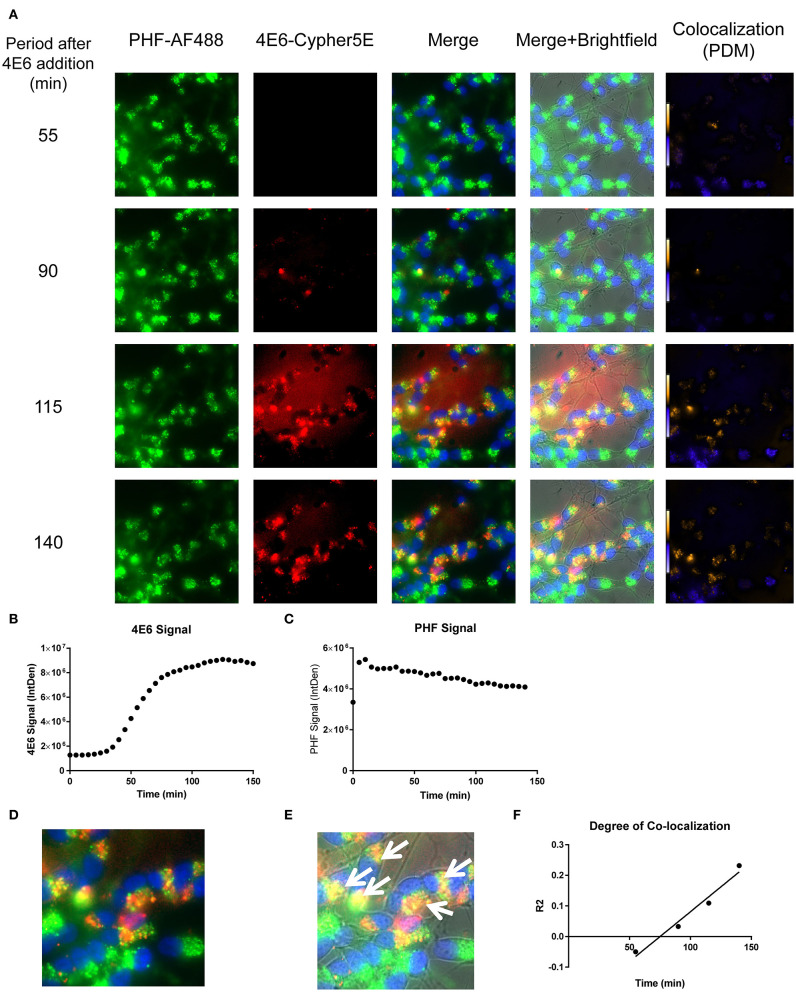
Time-lapse live imaging shows a strong correlation between PHF and 4E6 in pre-treated DC. DC were pre-incubated with 50 μg/mL tagged PHF-AF488 for 16 h, washed, incubated with Hoechst stain, washed again, and then incubated with Cypher5E-tagged 4E6 tau antibody for up to 140 min. Cells were analyzed using live time-lapse live imaging at 5 min intervals. (A) Shows still frames from the live imaging of the 55–140 min time points, with all analyzed channels. The 4E6-Cypher5E signal increased over time, while the PHF signal did not change. In addition, an intensity co-localization analyses was performed between the 4E6 and PHF signals, which generates a co-localization heat map and intensity correlation coefficient (R2). The colocalization heat map (PDM) showed increasing intensity over time, as indicated by the yellow color, which depicts greater colocalization. Internalization of 4E6 occurred primarily in the soma, and was peri-nuclear, while the PHF resided in the soma at the beginning of the experiment. (B) Shows quantification of the 4E6-Cypher5E signal, where the signal increased over time, and began to plateau near 75 min. (C) Shows quantification of the PHF-AF488 signal, which showed no change within the 140 min. (D,E) The 140 min Merge and Merge + Brightfield images were magnified to show more detailed morphology and localization of 4E6 tau antibody and PHF co-localization in the cells. Most of the antibody signal was localized in the soma of the cells, and was peri-nuclear as indicated by the white arrows. (F) Shows the intensity correlation coefficients of PHF and 4E6 (R2 = −0.05 to 0.232), which increased linearly, and correlated well over time (r2 = 0.969, p = 0.0157, Pearson, two-tailed).

