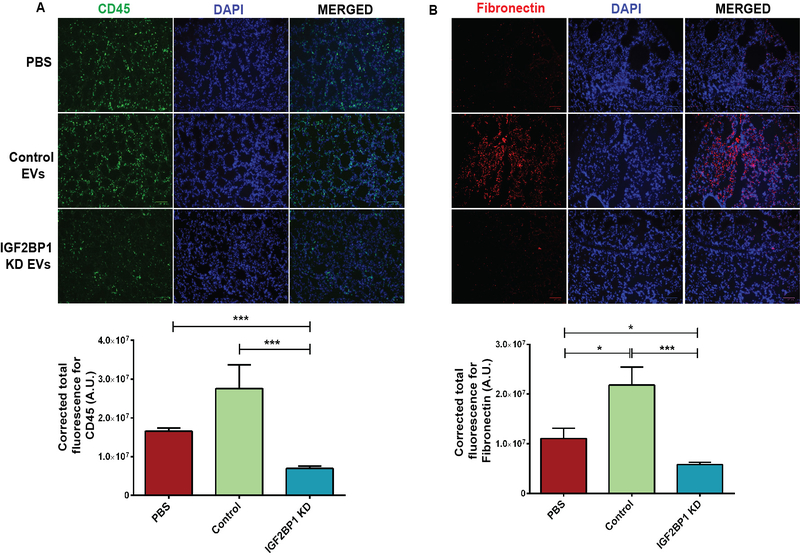
Figure 5.
Analysis of pre-metastatic niche formation in lungs. A, Expression of CD45 (top panel) with quantitative analysis in the bottom panel. B, Expression of fibronectin with quantitative analysis in the bottom panel. Expression of both CD45 and fibronectin increased markedly in the lungs of the mice treated with EVs (isolated with the sucrose cushion method) from control SW1 cells, as compared to the mice that did not receive EVs or the mice that received EVs from IGF2BP1 knockdown SW1 cells. Scale bar is 100 μm.

