
Figure 3. Predictive modeling of the ratios and differences between MPRA methods.
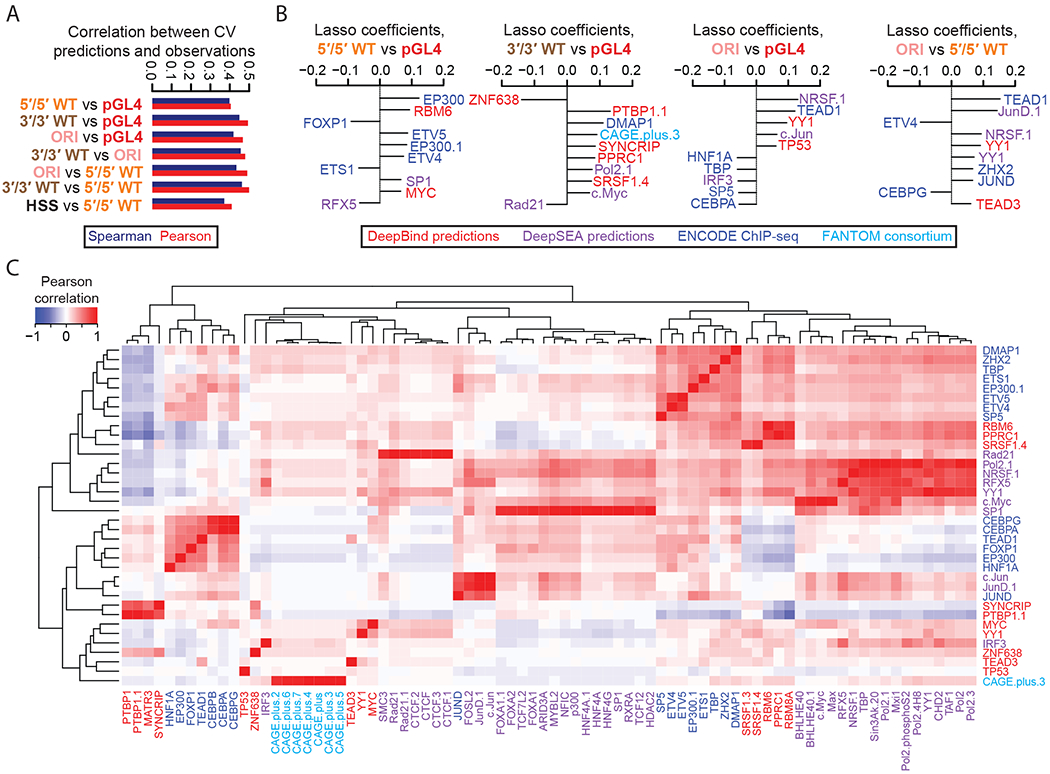
A) Pearson and Spearman correlation coefficients for 10-fold cross-validated predictions derived from lasso regression models and the observed RNA/DNA ratios, for each of the 7 indicated differential comparisons tested. Also indicated are the Pearson (r) and Spearman (rho) correlation values. B) The top 10 coefficients derived from lasso regression models trained on the full dataset to predict observed differences in the indicated pairs of MPRA methods. Features with the extension “.1”, “.2”, etc allude to redundant features or replicate samples. C) Pearson correlation matrix between the union of all top 10 features from (B), shown as rows, and other features sharing a Pearson correlation either ≤ −0.8 or ≥ 0.8, shown as columns. Feature names are colored according to the origin of the feature as shown in the boxed key above. Hierarchical clustering was used to group features exhibiting similar correlation patterns.