
Figure 5. Including additional sequence context around tested elements leads to differences in the results of MPRAs.
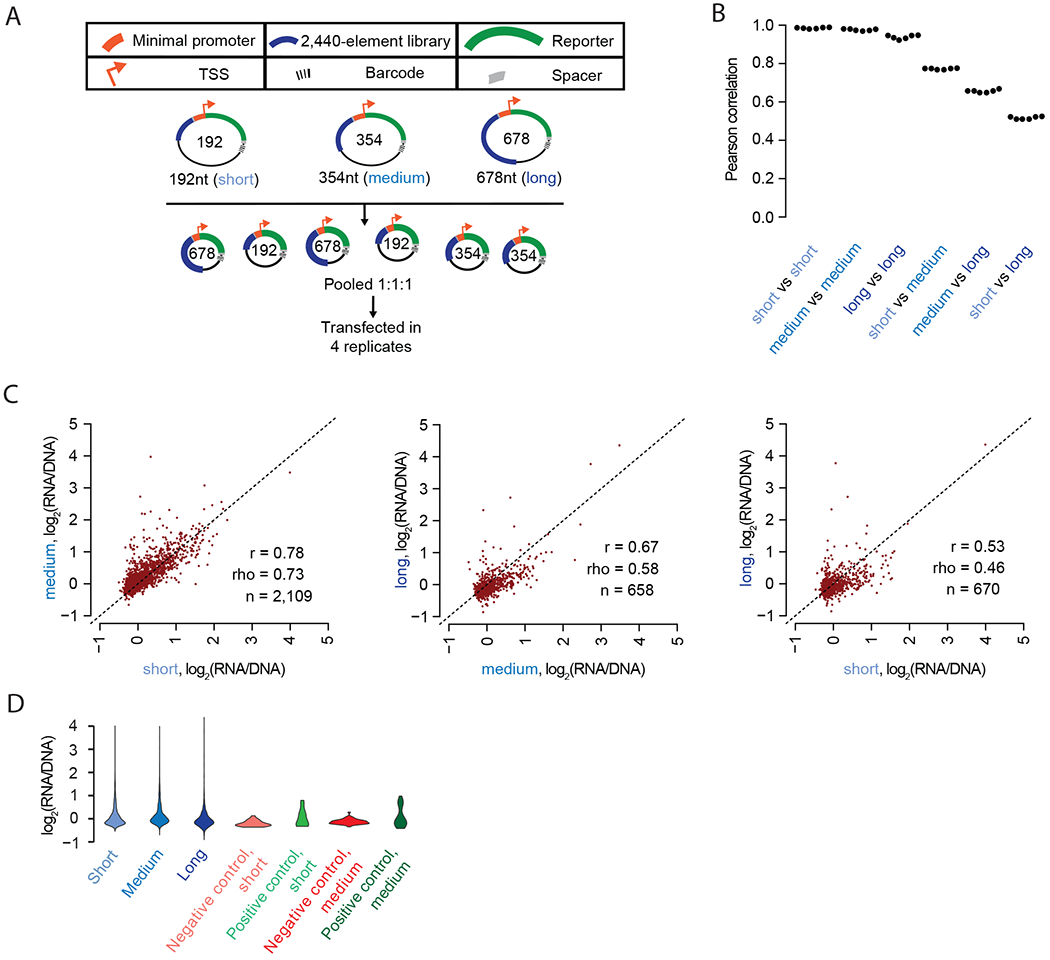
A) Experimental schematic. 192 bp, 354 bp, and 678 bp libraries were synthesized, assembled, and cloned into the pGL4 backbone. These were pooled and transfected into HepG2 cells in quadruplicate. B) Beeswarm plot of the Pearson correlation values corresponding to each of the six possible pairwise comparisons among the four replicates. The correlations are computed between observed enhancer activity values for elements measured in each of the three possible size classes. C) Scatter plots of the average activity score of each element, comparing short vs. medium, medium vs. long, and short vs. long versions of each element, and restricting to elements detected with at least 10 unique barcodes at both lengths (n). D) Violin plot displaying the distribution of average log2(RNA/DNA) ratios for short, medium, and long versions of the elements tested, as well as for positive and negative controls at short and medium lengths.