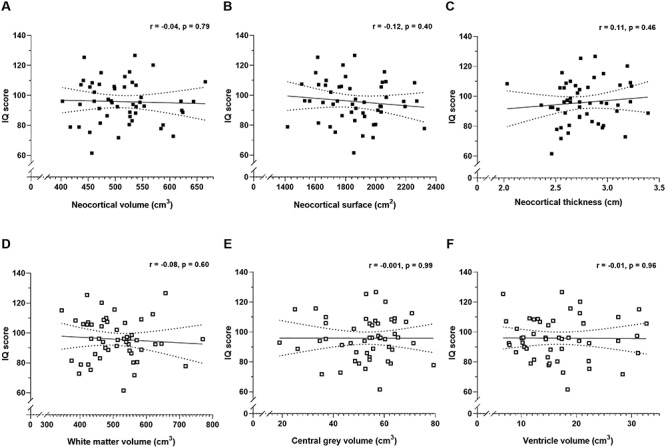
Figure 2.

Pearson’s correlation coefficients (r) between IQ score and estimates of total neocortical volume (A, ■), surface area (B, ■), and mean thickness (C, ■). Also shown are the correlations between IQ score and the volume of white matter, (D, □), central gray (E, □), and cerebral ventricles (F, □). The correlations are shown with 95% confidence intervals (dotted lines).
