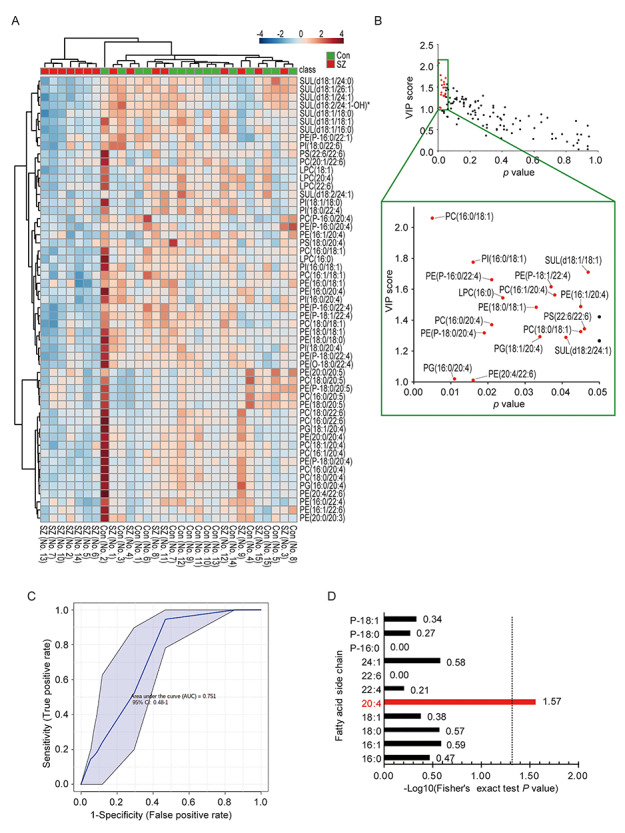
Figure 1.

Analysis of lipidomic data from patients with schizophrenia and controls. (A) Cluster analysis of lipids with a PLS-DA VIP scores > 1.0. Each column represents a sample, and each row represents a lipid. The color indicates the relative lipid contents of each group. Green and red marks represent controls (Con) and patients with schizophrenia (SZ), respectively. *The existence of other molecular species at the same m/z and retention time. The possibility that control no. 2 was an outlier could not be ruled out. (B) Selection of lipids that can help differentiate between the schizophrenia and control samples. The x-axis and y-axis represent the P values of Mann–Whitney U test and VIP score, respectively. Red marks indicate selected lipids (Mann–Whitney U test, P < 0.05 and PLS-DA VIP score > 1.0) which differentiate between schizophrenia and control. (C) ROC curve to plot the performance of the combination of selected 17 lipids. The x-axis and y-axis represent 1-specificity and sensitivity, respectively. The AUC is shown with 95% confidence limits. (D) Enrichment analysis of the fatty acid side chain(s) of selected lipids that can discriminate between the schizophrenia and control samples. The x-axis represents the log10 of the P values of enriched terms, calculated by Fisher’s exact test.
