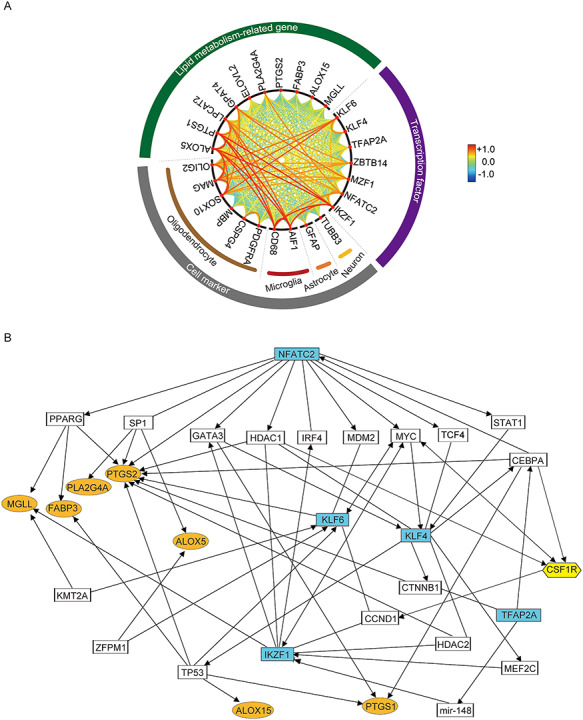
Figure 2.

Interactions among identified schizophrenia-related genes. (A) Correlations between lipid metabolism-related genes, transcription factors, and cellular markers are displayed in a circle. The larger the absolute value of the correlation coefficient between two genes, the more the line connecting the genes is placed in front and in red color. (B) Predicted schizophrenia-related gene expression network by ingenuity pathway analysis. Transcription factors, lipid metabolism-related genes, and CSF1R dysregulated in schizophrenia are highlighted in blue, orange, and yellow, respectively. Each interaction is supported by at least one literature reference.
