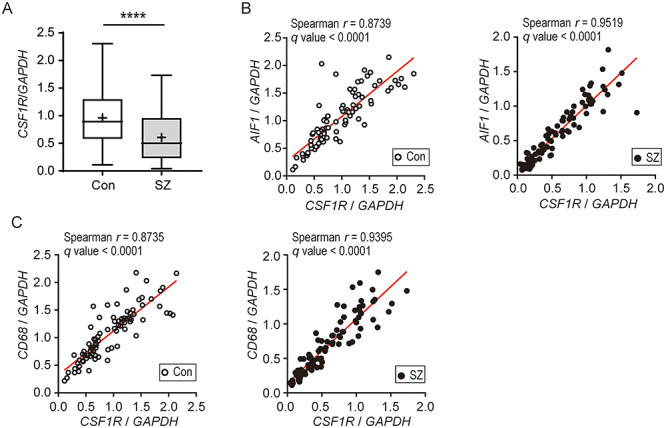
Figure 3.

Expression levels of CSF1R and correlations between the expression levels of CSF1R and microglial markers in the corpora callosa of patients with schizophrenia and healthy controls (A) Box and whisker plots of the expression levels of CSF1R (Con, n = 85; SZ, n = 90). GAPDH was used as an internal control. The horizontal line in the box represents the median value, and the + represents the mean. Whiskers represent the 25th and 75th percentiles, and dots represent outliers. ****P < 0.0001. (B, C) Spearman’s correlation coefficients describing the relationships between the expression levels of CSF1R and microglial markers, AIF1 (B) and CD68 (C). Open circles (left panel) and closed circles (right panel) indicate controls and patients with schizophrenia, respectively.
