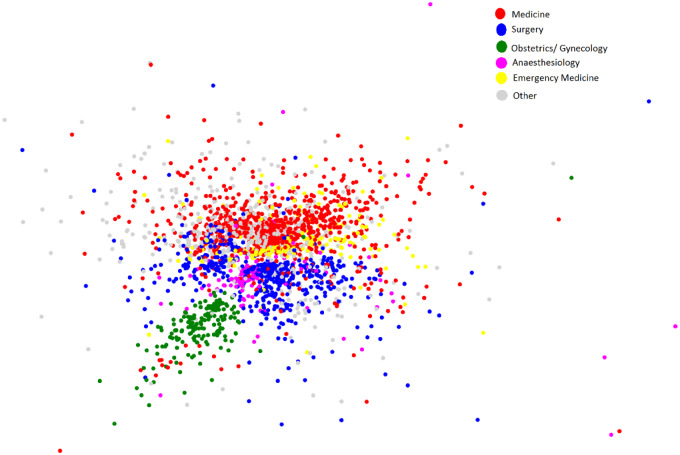
Figure 5.
Social network analysis of provider interactions for a single hospital. Each point represents an individual provider and the distance between the points indicates how often the providers interact with one another. Providers who interact frequently are close together while providers who interact infrequently are far apart. Within each network, individuals who have more interactions are also more connected and more influential.

