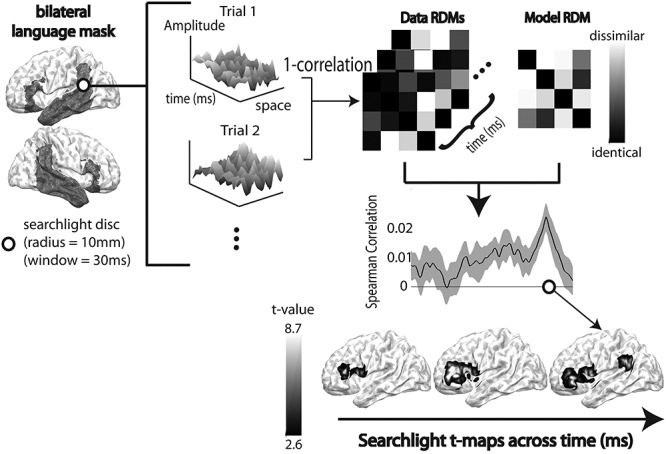
Figure 4.

A schematic illustration of the searchlight RSA of spatiotemporal source-space EMEG data. The bilateral language mask used in this study is surface-rendered onto the brain template in the figure for visualization. Since the source-space EMEG data inherently vary across time and space, we calculated the similarity of the spatio-temporal patterns of brain activities for different trials based on measurements within each searchlight sphere with a spatial radius of 10 mm and a temporal radius of 30 ms. We used 1—Pearson’s correlation between pairs of trials as the distance metric to compute an RDM for each searchlight, yielding a searchlight map of data RDMs. Each data RDM is then correlated with each model RDM using Spearman’s correlation. This Spearman’s correlation was computed for each subject and the significance of the correlation at each searchlight location was tested using one-sample t-test (H0: Spearman correlation will be zero). The figure illustrates this process, yielding a time-course of t-values across spatiotemporal searchlights.
