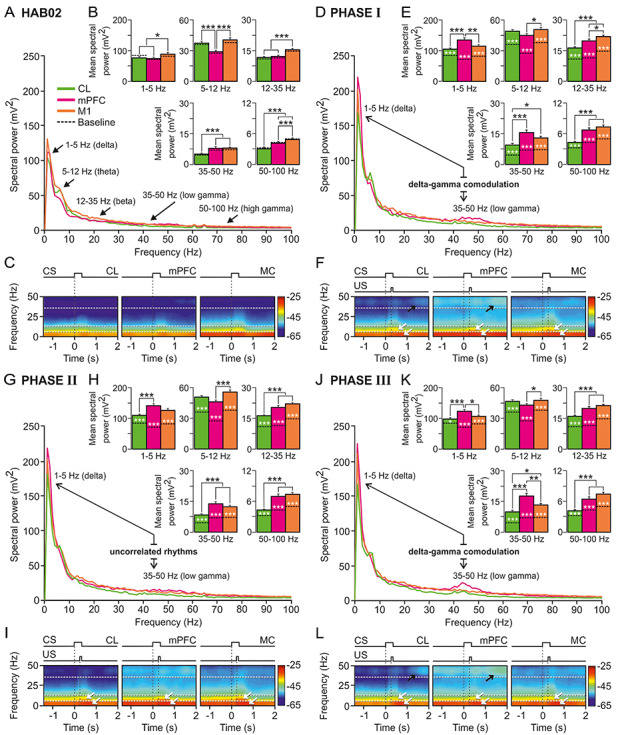
Figure 6.

Spectral analyses of LFPs recorded in CL (green), mPFC (magenta), and MC (orange) during classical eyeblink conditioning. (A) Mean power spectra of LFPs recorded in the three recording sites between 1.5 s before and 2 s after the CS initiation during the second habituation session (HAB02). Black arrows indicate spectral ranges corresponding to delta (1–5 Hz), theta (5–12 Hz), beta (12–35 Hz), and low- (35–50 Hz) and high- (50–100) gamma bands. (B) Histograms of mean spectral powers for all frequency bands. Baseline values (collected from HAB02 sessions, including no stimulus) are also represented (dotted black line inside the bars); note that they are very similar to those collected during the presentation of the unpaired CS (HAB02). (C) Spectrograms corresponding to data illustrated in A, B. Note that the maximum values of spectral power (see the color calibration bar at the right) appeared during and after CS presentations, and the fundamental contribution to the spectral power was determined by delta and theta bands. (D–L) Same representations and analyses for LFPs recorded in CL, mPFC, and MC during phase I (D–F), phase II (G–I), and phase III (J–L). Note that the most-prominent and -differentiated power peaks appeared in delta, theta (white arrows in the spectrograms), and low gamma (black arrows in the spectrograms) bands for the mPFC and CL spectra during conditioning phases I and III (but not during phase II, just when CL neuron activation reached its maximum firing rates). This suggests the possibility of delta–gamma comodulations in D and J but uncorrelated rhythms in panel G. For all the multiple comparisons (Tukey–Kramer test: *P < 0.05; **P < 0.01; ***P < 0.001).
