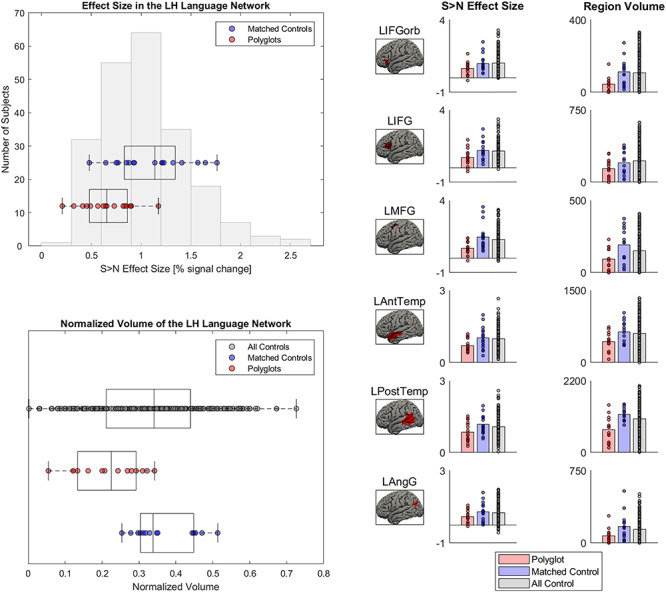
Figure 1.

Functional response properties of the LH language network in polyglots versus non-polyglots. Left: The Sentences > Nonwords effect sizes and region volumes are shown as box-and-whisker plots for polyglots and matched non-polyglots (red and blue dots, respectively) and as a histogram for a larger sample of non-polyglots (n = 217). Right: The effect sizes and region volumes for the three groups (polyglots, matched non-polyglots, larger set of non-polyglots) are shown as bar plots for the six language regions separately. Group differences in effect sizes and region volumes were present in the LH language network.
