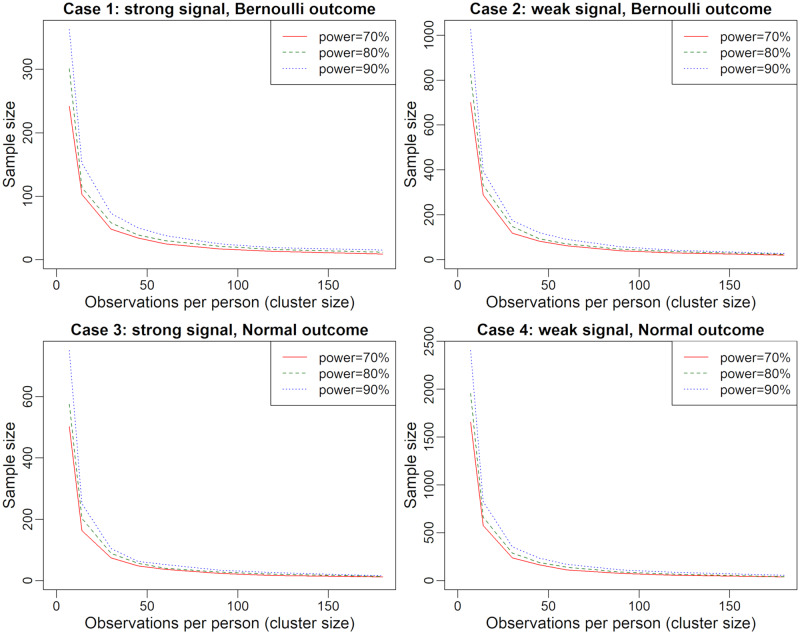
Figure 2.
Sample size and follow-up duration in relation to the power of association tests in population-level analysis. Simulations based on the number of days where both predictor and outcome are collected. For each power level and each fixed , sample size was varied using a binary search with 500 iterations at each step in order to identify the sample size that led to the desired power.

