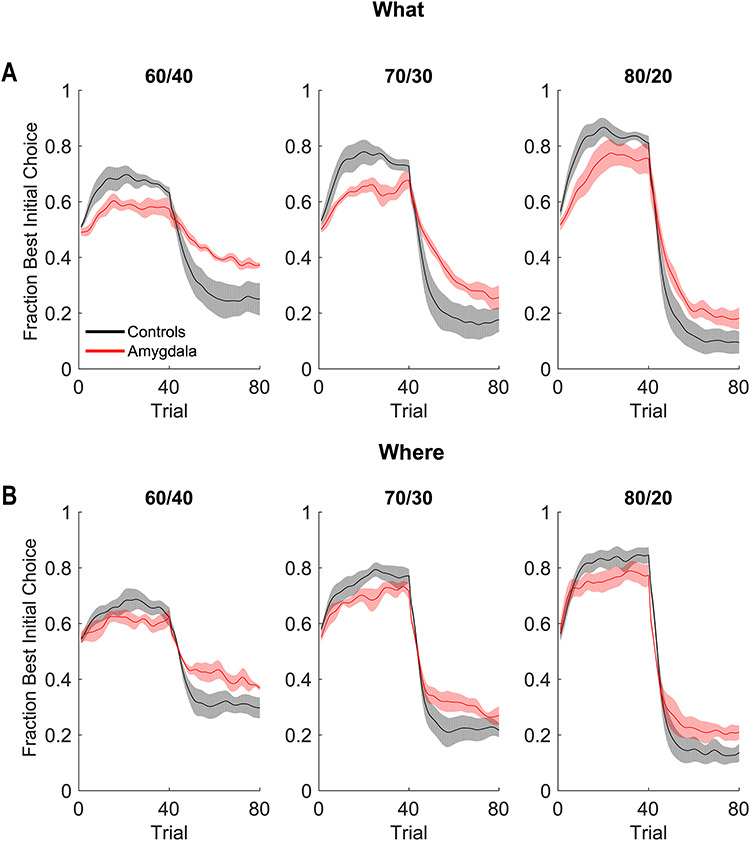
Figure 2.

Behavioral performance in What and Where conditions. (A) Fraction of times the animals chose the best initial cue in the What condition. Shaded region indicates ±1 standard error mean (SEM), where the N = the number of animals in each group (4 lesion, 6 control). (B) Same as A for the Where condition.
