
Figure 3.
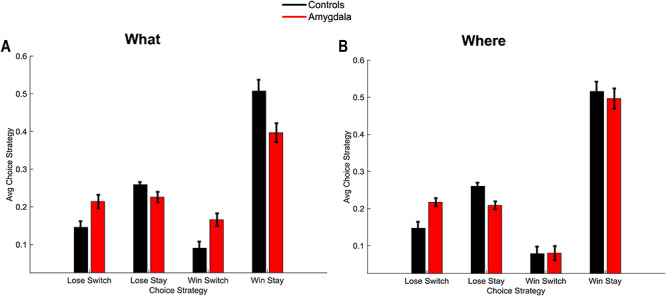
Win-stay, Lose-switch. (A) Win-stay, lose switch performance for the two groups in the What condition, averaged across schedules. (B) Win-stay, lose-switch performance for the two groups in the Where condition, averaged across schedules. Error bars are ±1 SEM (N = 6 control, 4 lesion).