
Figure 9.
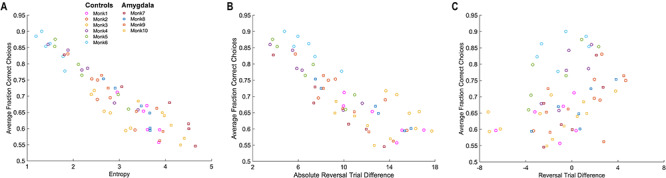
Correlation plots for all 10 monkeys (6 control, 4 lesion). (A) The correlation between fraction correct and entropy. (B) Same as A, but the correlation is between fraction correct and absolute reversal trial difference. (C) Same as A, but the correlation is between fraction correct and reversal trial difference.