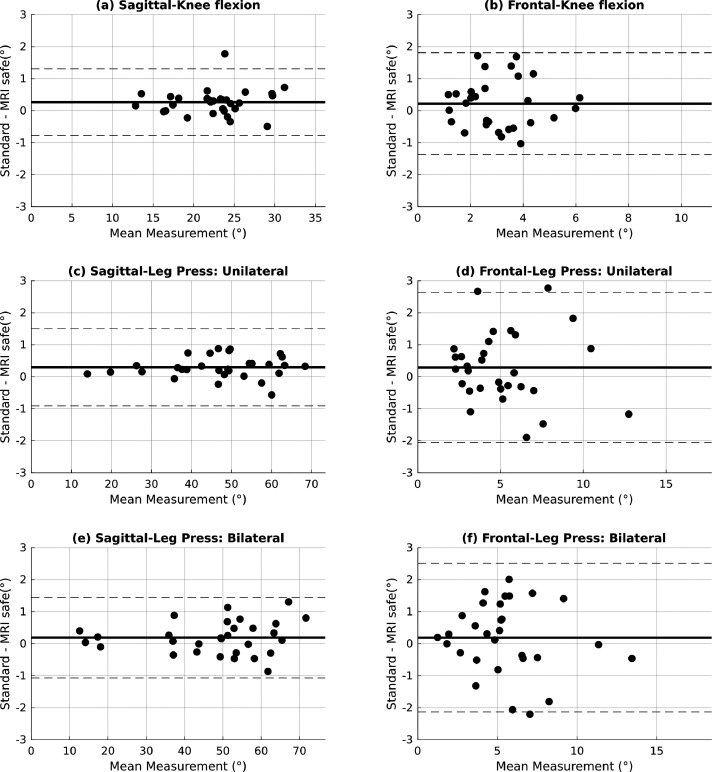
Figure 3.
Bland-Altman plots of knee sagittal and frontal plane angles for all exercises. Mean of the measured angles by both systems is plotted along x-axis and the respective differences along y-axis. The bold horizontal line represents the mean of the difference between the two systems and the dashed lines represent 95% LoA.

