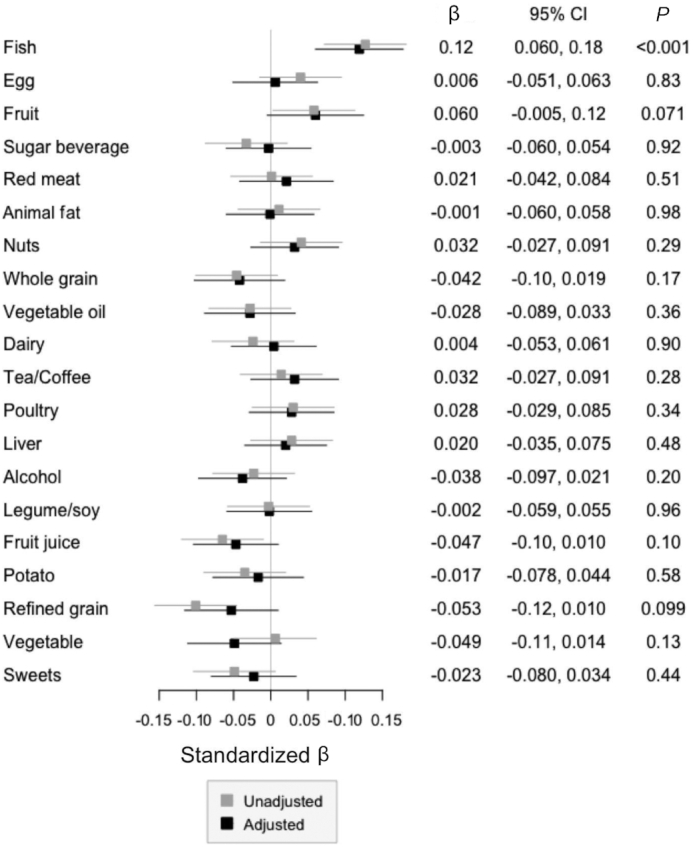
FIGURE 3.

Association between 7DDR-defined food groups and TMAO concentration. Linear regression models for log-transformed TMAO concentrations by the 7DDR-based food groups in 620 healthy males were built. The results of the unadjusted (gray) and adjusted (black) models are presented. In the adjusted model, age, race, metabolic equivalents per week, total calories per day, BMI, and every food group were adjusted. The numbers indicate the standardized β (dots) and P value of each food group in the adjusted model. Bars indicate the 95% CIs. TMAO, trimethylamine-N-oxide; 7DDR, 7-d dietary record.
