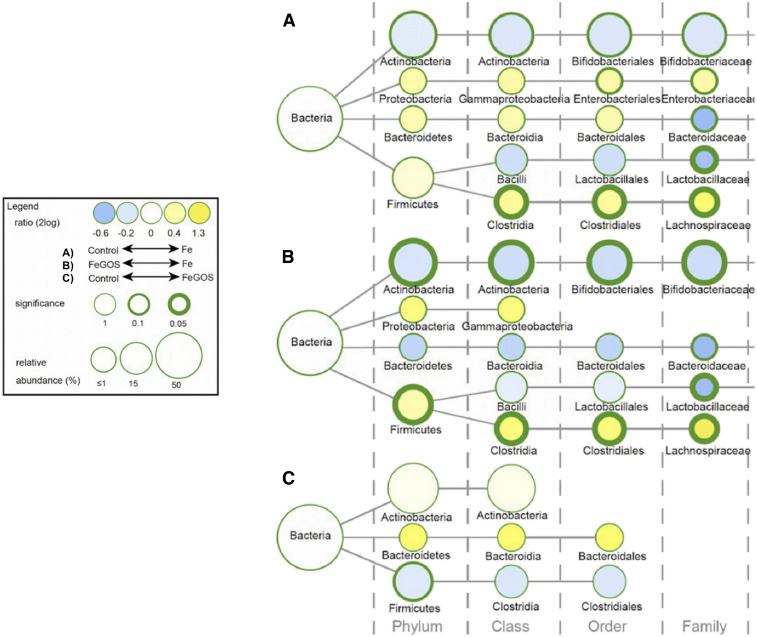
Figure 3.
Differences in the gut microbiota composition among Kenyan infants (n = 155) after receiving daily for 4 months an MNP without iron (control group), with 5 mg of iron (Fe group), or with 5 mg iron and 7.5 g galacto-oligosaccharides (FeGOS group). Nodes represent taxa; edges link the different taxonomic levels. Node sizes correspond to the relative taxa abundance (%). The fold difference is calculated as the 2log of the ratio of the relative abundance between groups. Mann–Whitney U tests were used for statistical comparisons. Adapted from Paganini et al.21

