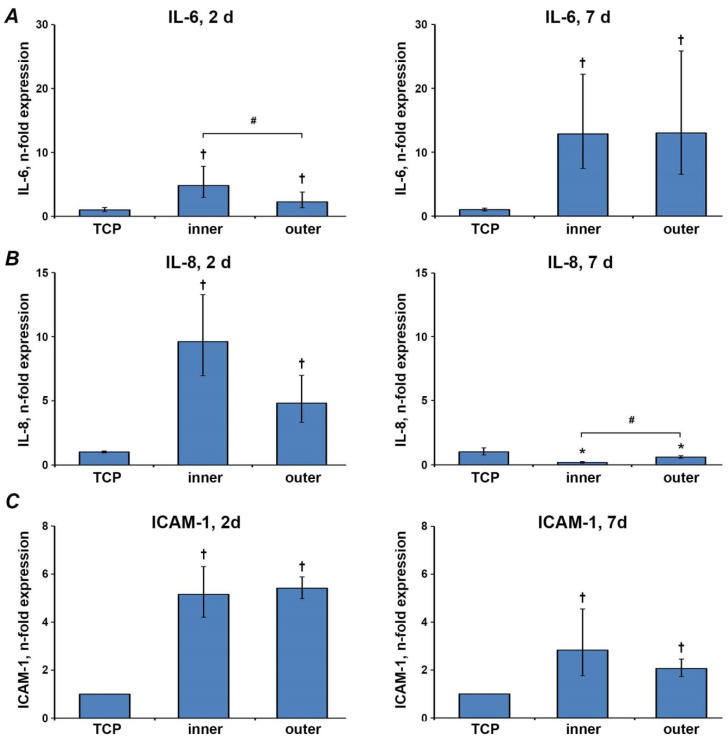
Figure 6.
Gene expression of inflammatory markers. Gene expression of IL-6 (A), IL-8 (B) and ICAM1 (C) after two and seven days in Ca9-22 cells grown on different aligners’ surfaces were measured by qPCR. Y-axes represent n-fold expression in relation to Ca9-22 cells grown on TCP (n-fold expression = 1), calculated using 2−ΔΔCt method. Data are presented as the mean ± s.e.m. of four independent experiments. †—significantly higher compared to control; *—significantly lower compared to control; #—significantly different between groups. p < 0.05.

