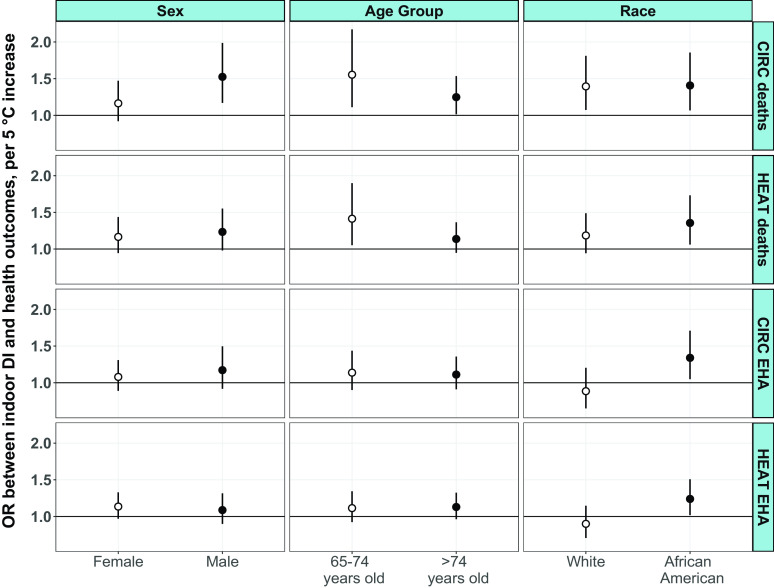
Figure 4.
Estimated ORs and 95% CIs per 5°C increase between 3-d moving averages of maximum indoor DI and health outcomes stratified by individual factors for City of Houston residents (June–September, 2000–2015). ORs were derived from single-exposure, time-stratified case-crossover models (conditional logistic regression), that matched on U.S. Census block group of subject residence, year, month, and weekday of the adverse health event. Models controlled for maximum ambient temperature and maximum ambient dew point temperature (°C) with cubic polynomials, federal holidays, day of the warm season, modeled as a smooth function with monthly knots across the summer season (June–September). An interaction term between year and day of the warm season was also included to capture between-year differences. Mortality data were available 2000–2015; EHA data were available 2004–2013. See Table 4 for corresponding numeric data. Note: CI, confidence interval; CIRC, circulatory diagnoses; DI, discomfort index; EHA, emergency hospital admissions; HEAT, heat-related diagnoses; OR, odds ratio.

