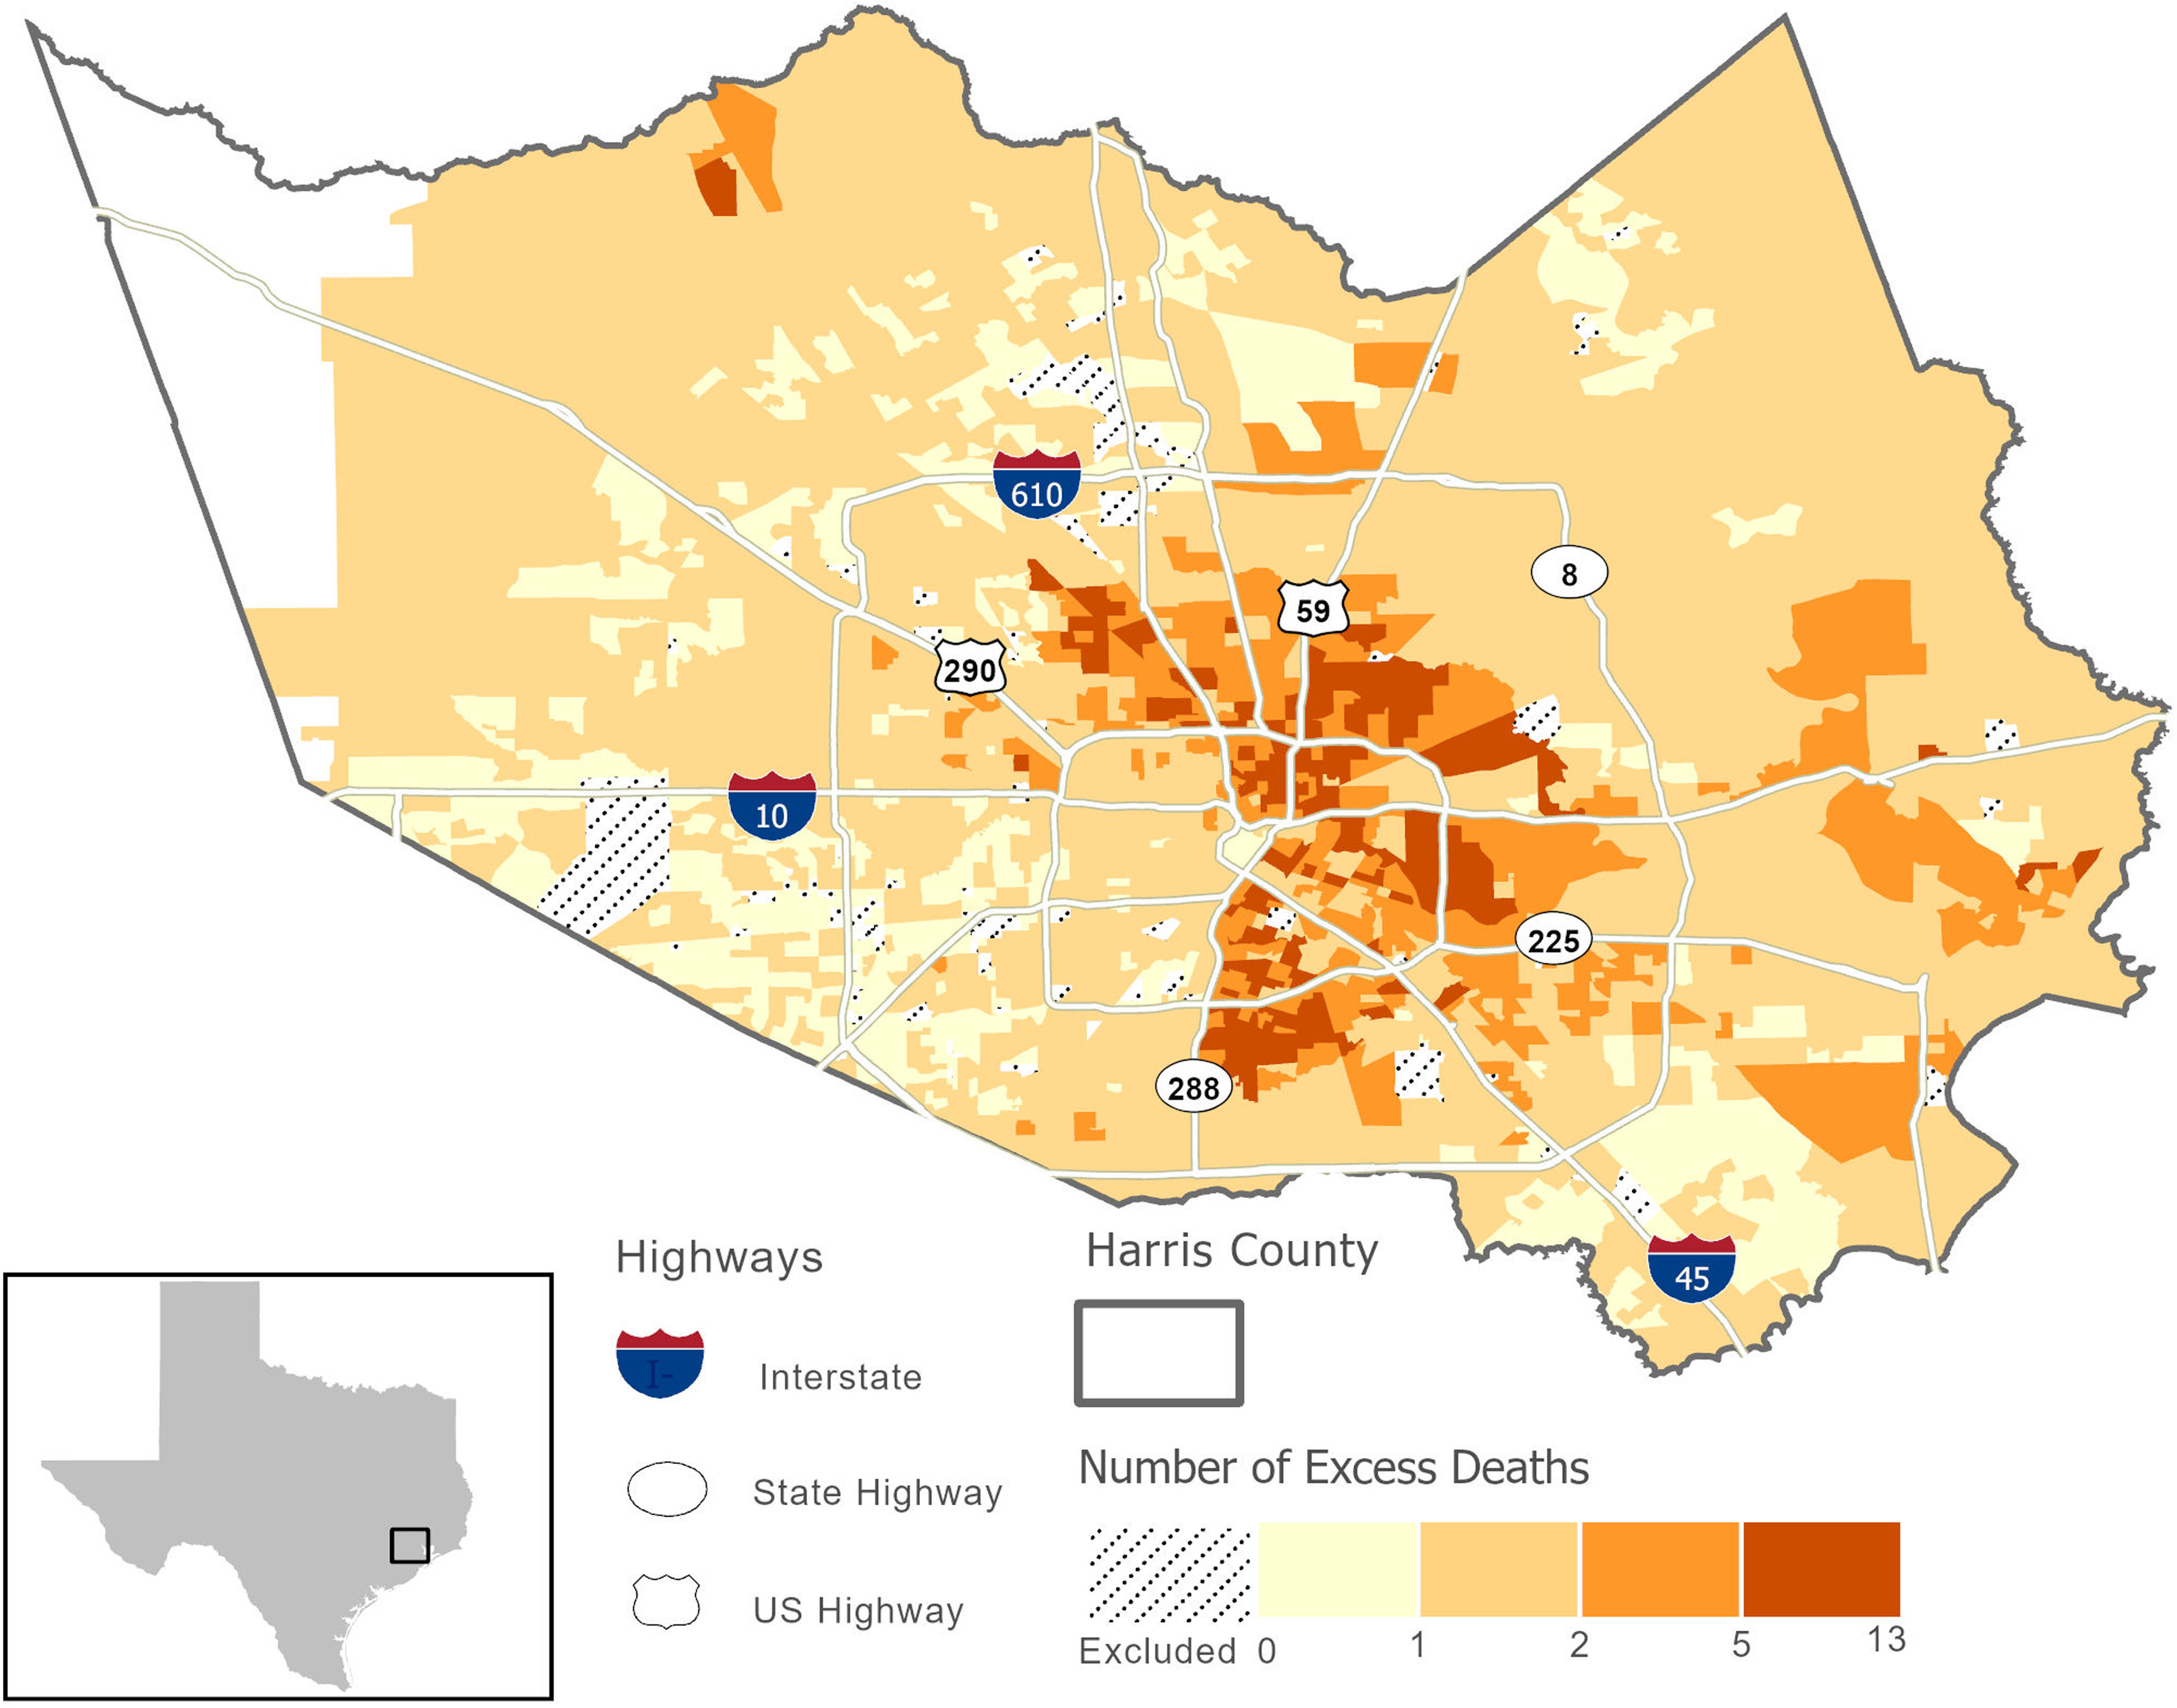
Figure 6.

Estimated number of heat-related deaths attributable to exposure to high indoor heat during the summer months (June–September) for each U.S. Census block group (CBG) in Harris County between 2000 and 2015. To map the estimated number of deaths across our study area, we used effect estimates between heat and mortality for City of Houston residents. Hatched areas represent CBGs excluded from analyses because all buildings within these CBGs were identified as nonresidential or because residential buildings could not be categorized into building archetypes used in our indoor modeling.
